Duchenne muscular dystrophy (DMD) is caused by mutations in the dystrophin gene that disrupt the production of functional dystrophin protein, resulting in progressive muscle damage and loss of contractile function. Currently, multiple therapeutic agents that aim to restore dystrophin expression are being evaluated in clinical trials (clinicaltrials.gov identifiers: NCT02310906, NCT02740972, NCT03368742, NCT03508947, NCT03769116, and NCT03362502). Eteplirsen (Exondys 51™; Sarepta Therapeutics, Inc., Cambridge, MA) received accelerated approval from the US Food and Drug Administration (FDA) based on an increase in dystrophin in some treated patients, as assessed by western blot,1,2 highlighting the importance of dystrophin quantification as an essential component of biochemical efficacy for dystrophin-restoring therapies. This report presents a review of the previously reported dystrophin amounts in muscular dystrophy biopsies, along with an analysis of critical variables impacting dystrophin quantitation.
Quantification of dystrophin protein by western blot involves many potential challenges that should be carefully considered when developing a method for use in clinical study.3 Western Blot is a method to detect and quantify proteins by transferring (blotting) proteins separated by electrophoresis from a gel to a membrane. A dystrophin protein standard does not exist at this time because large scale recombinant expression of the complete 427 kD protein has not been possible. Thus, extracts of healthy control muscle must be used to generate a standard curve. The use of healthy controls as the standard for quantifying dystrophin has led to the practice of reporting dystrophin amounts in terms of percent dystrophin found in healthy control (e.g., percentage of healthy control where the control is assumed to be 100%). A standard curve is typically setup such that healthy control lysate is spiked into DMD lysate to create a standard curve with a range of dystrophin amounts relative to the healthy control which is set at 100%. For example, to construct a 50% standard, equal protein amounts of healthy lysate and DMD lysate are combined. The issue with this practice is that all reports of dystrophin amounts, even with “quantitative methods”, are relative in nature because dystrophin quantity in muscle biopsies from healthy controls varies between individuals. An added complication stems from the inability to utilize a single healthy standard across sites because these biopsies are typically small in size.4
The large size of the dystrophin protein and its susceptibility to proteolysis pose challenges with extracting the protein, and there can be further difficulties associated with electrophoretic separation on a sodium dodecyl sulfate polyacrylamide gel for accurate, albeit relative, quantification. Further, some DMD biopsies contain high fat and fibrotic tissue, which could impact the accuracy of dystrophin quantitation. Lastly, dystrophin is found in low abundance in healthy muscle tissue and at even lower abundance in diseased muscle, which pushes the limits of sensitivity for various assay designs and detection methods.
Dystrophin levels in baseline Becker muscular dystrophy biopsies
Levels of dystrophin expression reported in patients with Becker muscular dystrophy (BMD) vary dramatically due to multiple factors, including the natural variation in actual dystrophin levels across patients, use of different detection methods, and application of different reference standards. The lack of a reference standard that can be universally implemented to measure dystrophin levels is an especially challenging problem that prevents comparisons across different laboratories. When analyzed using diagnostic western blot methods that lacked a standard curve which makes the assay inherently non-quantitative (often referred to as single-point reference standards), dystrophin levels in biopsies from patients with BMD ranged from undetectable to having equivalent amounts of dystrophin of those from healthy controls.5–11
A consortium of leading laboratories published a study in 2014 on standardization of immunohistochemistry and Western blot dystrophin quantification methods.12 Western blot analysis showed that the dystrophin levels in three biopsies from patients with BMD ranged from 51–140% compared with an average of two healthy control biopsies;12 inter-laboratory coefficient of variation values ranged from 23–45%. The one BMD biopsy that had higher levels of dystrophin than the average of the healthy controls12 (140% compared to 100% for BMD versus controls, respectively) demonstrates either the variability in dystrophin between individuals or the lack of resolution in the method. In a separate Western blot analysis by Hathout et al. that utilized a standard curve constructed from a single healthy control biopsy, dystrophin expression in a biopsy from a patient with BMD was 2% compared with the healthy control biopsy. Interestingly, mass spectrometry analysis quantified the dystrophin levels at 7%.13 Additional reports by van den Bergen et al., using a quantitative western blot method with a standard curve, found dystrophin levels ranging from 3–78% in biopsies from patients with BMD.14 Lastly, a survey of 25 BMD samples using capillary western immunoassay (Wes) from ProteinSimple (San Jose, CA, USA) by Beekman et al. showed a range of dystrophin from 10–90% compared with a normal human muscle lysate.15
Using quantitative western blot methodology, we assessed dystrophin levels in biopsies from patients with BMD and in healthy control samples (n=3 each). Dystrophin levels in the BMD samples were substantially lower (2%, 18%, and 32%) compared with levels reported in the non-dystrophic control tissue (52%, 85%, 96%).1 Additionally, we evaluated a patient with muscular dystrophy who presented as an intermediate phenotype based on a 6-minute walk test (6MWT). This 10-year-old patient walked 575 meters compared with age-matched patients with DMD that walk 366 meters. Western blot analysis of this intermediate patient showed 3.2% dystrophin protein compared with a healthy control muscle standard.16 Clearly, the accuracy of any single report may be questionable depending on the sophistication of the methodology used. Dystrophin levels reported across different studies cannot be directly compared because of variation in the methodology, muscle source, disease state, mutation type, and in the reference samples used.
Taken together, these studies indicate that dystrophin expression in patients with BMD varies appreciably and multiple reports found dystrophin to be <5% in patients using methods with a standard curve.1,13,14
Dystrophin in baseline Duchenne muscular dystrophy biopsies
Levels of dystrophin expression reported in patients with DMD also vary widely; this makes interpretation of the relevance of therapeutic restoration of dystrophin difficult.17 Hoffman and colleagues were the first to correlate the clinical phenotype of BMD and DMD to the presence or absence of dystrophin protein.18 A qualitative assessment of dystrophin amount by western blot led to the initial conclusion that patients with DMD might have up to 3% of the dystrophin levels compared to healthy individuals. Anthony et al., with the consortium of laboratories mentioned previously, surveyed three DMD biopsies and found 0% (undetectable), 0.4%, and 11% dystrophin compared with the healthy control used.12
Clinical analyses of dystrophin-restoring therapies have examined pre-treatment DMD biopsies by western blot. A single pre-treatment biopsy was assessed by western blot in a study evaluating the safety and pharmacokinetics of systemic administration of PRO051, an antisense oligonucleotide that has the same mechanism of action as eteplirsen but with a different chemical structure. While no values were reported for dystrophin measurements, based on the intensity of the dystrophin band in the pre-treatment sample it appeared that there is less than 1% dystrophin of a healthy muscle control.19 Several studies have assessed baseline biopsies using a standard curve that should lead to more accurate quantification of dystrophin. An initial analysis of eteplirsen-induced dystrophin production revealed that dystrophin expression in baseline DMD biopsies ranged from 0–5% of the healthy control used.20In a more recent analysis of eteplirsen activity that used a validated western blot method optimized to quantify levels of dystrophin between 0.25–4.00%, nine pre-treatment DMD biopsies were surveyed and found to have a mean dystrophin expression of 0.08% compared with the healthy control.1 The highest dystrophin level found among these pre-treatment DMD biopsies was 0.37% of the healthy control.
We surveyed >30 baseline DMD biopsies from patients with genetic mutations amenable to exon 51 and exon 53 skipping using this validated method and found only four samples with dystrophin levels >0.25% of the healthy control. The greatest amount of dystrophin expression reported in all of these baseline biopsies, using a five-point standard curve ranging from 0.25–4.00%, was only 0.37%.1,21
Further support of trace levels of dystrophin in baseline DMD biopsies was found using the Wes technology from ProteinSimple conducted by BioMarin Pharmaceutical Inc.15 Four baseline DMD biopsies were assessed that are amenable to exon 53 skipping and found to have dystrophin levels below 0.2% when quantified using a healthy muscle lysate standard curve. Some DMD samples had up to 7% dystrophin but these were patients who had mutations that were amenable to exon 44 skipping, which are known to have higher levels of dystrophin.3,22
Two clinical trials designed to evaluate NS-065/NCNP-01, a morpholino antisense oligonucleotide that promotes exon 53 skipping, also utilized western blot methodology to measure dystrophin expression.23,24 Both studies incorporated a standard curve ranging from 1.00% to ≥25.00%, and one study utilized a quadratic equation to determine dystrophin amounts. Depending on the treatment cohort being analyzed, mean baseline dystrophin levels ranged from 0.30–1.13% with peak baseline biopsy dystrophin ranging from 2.60% in one study to >6.00% in the other.23,24 It is clear that even when using standard curves and validated western blot methods, disparate dystrophin values may be produced from baseline DMD biopsies. Multiple factors could explain how western blot methods could lead to >20-fold differences in baseline dystrophin from patients who have similar dystrophin mutations. These variables, as discussed below, include the amount of dystrophin extracted in the standard lysate, the composition and range of the standard curve, the regression analysis performed to calculate dystrophin in patient samples, and normalization for muscle content.
The use of human tissue as a reference standard for quantifying dystrophin
The lack of a universal standard for measuring dystrophin could be a major contributor to the reported differences in dystrophin levels. Recombinant dystrophin has been very difficult to produce at scalable levels. Some recombinant dystrophin isoforms are commercially available, but all of these are vastly smaller isoforms that are not relevant to the detection and analysis of the full-length 427 kD protein which is lacking in patients with BMD and DMD. This unmet need has led to the use of either cellular extracts or, more commonly, extracts from healthy human muscle as the standard. However, clear problems exist in using either of these standards from an interpretation standpoint. Cellular-derived standards often lose the capacity to express biologically appropriate levels of dystrophin and should not be used to assess human muscle dystrophin. The amount of dystrophin in non-BMD/DMD “healthy” muscle samples has been reported to be variable,25,26 and is further complicated by uncertainties regarding variations in expression levels across different muscle groups within the same individual, and the extreme susceptibility of dystrophin to proteolysis. Figure 1A is an example of the variation of the dystrophin levels in vastus medialis across 14 non-DMD/BMD patients. The variation in dystrophin levels in this analysis was more than threefold, which is consistent with other reports where dystrophin ranged from 60–130%3 over 30 healthy biopsies and a survey of 31 healthy biopsies using ProteinSimple, which showed a variation of three- to five-fold.15 Our results, which show a lack of an age-dependent association with dystrophin amount, are also consistent with the survey healthy biopsies using ProteinSimple.15 However, a larger cohort is required to determine the magnitude of dystrophin variation and any age or gender effects. Beyond the individual variation in dystrophin expression, there is also potential for additional fluctuation in dystrophin according to muscle type. Figure 1B shows a survey of muscle types taken from a healthy young male pig. Excluding the masseter, liver, and kidney, a three-fold variation in dystrophin occurs across muscle types. Such a difference will clearly impact relative quantification of dystrophin. Should a similar pattern of dystrophin variation exist in human muscle, it is evident that analysis of biopsies from treated patients with DMD should ideally be compared with reference samples from the same muscle type.
A significant factor contributing to the disparate reports on the amount of dystrophin in DMD and BMD samples from historical publications is the use of a single-point standard for quantitation. Enzyme-based detection systems for western blot are known to be non-linear.27 Saturation often occurs at the top end of the range and leads to overestimation at the low end of the range. Brown et al. assessed two BMD biopsies, a ‘low’ and a ‘high’ dystrophin biopsy, using a single-point standard over four exposures.28 The low BMD biopsy showed dystrophin production ranging from 1.6–11.0% as the exposure saturated; the high BMD biopsy ranged from 12.0–74.0% based on short versus long exposure, respectively.
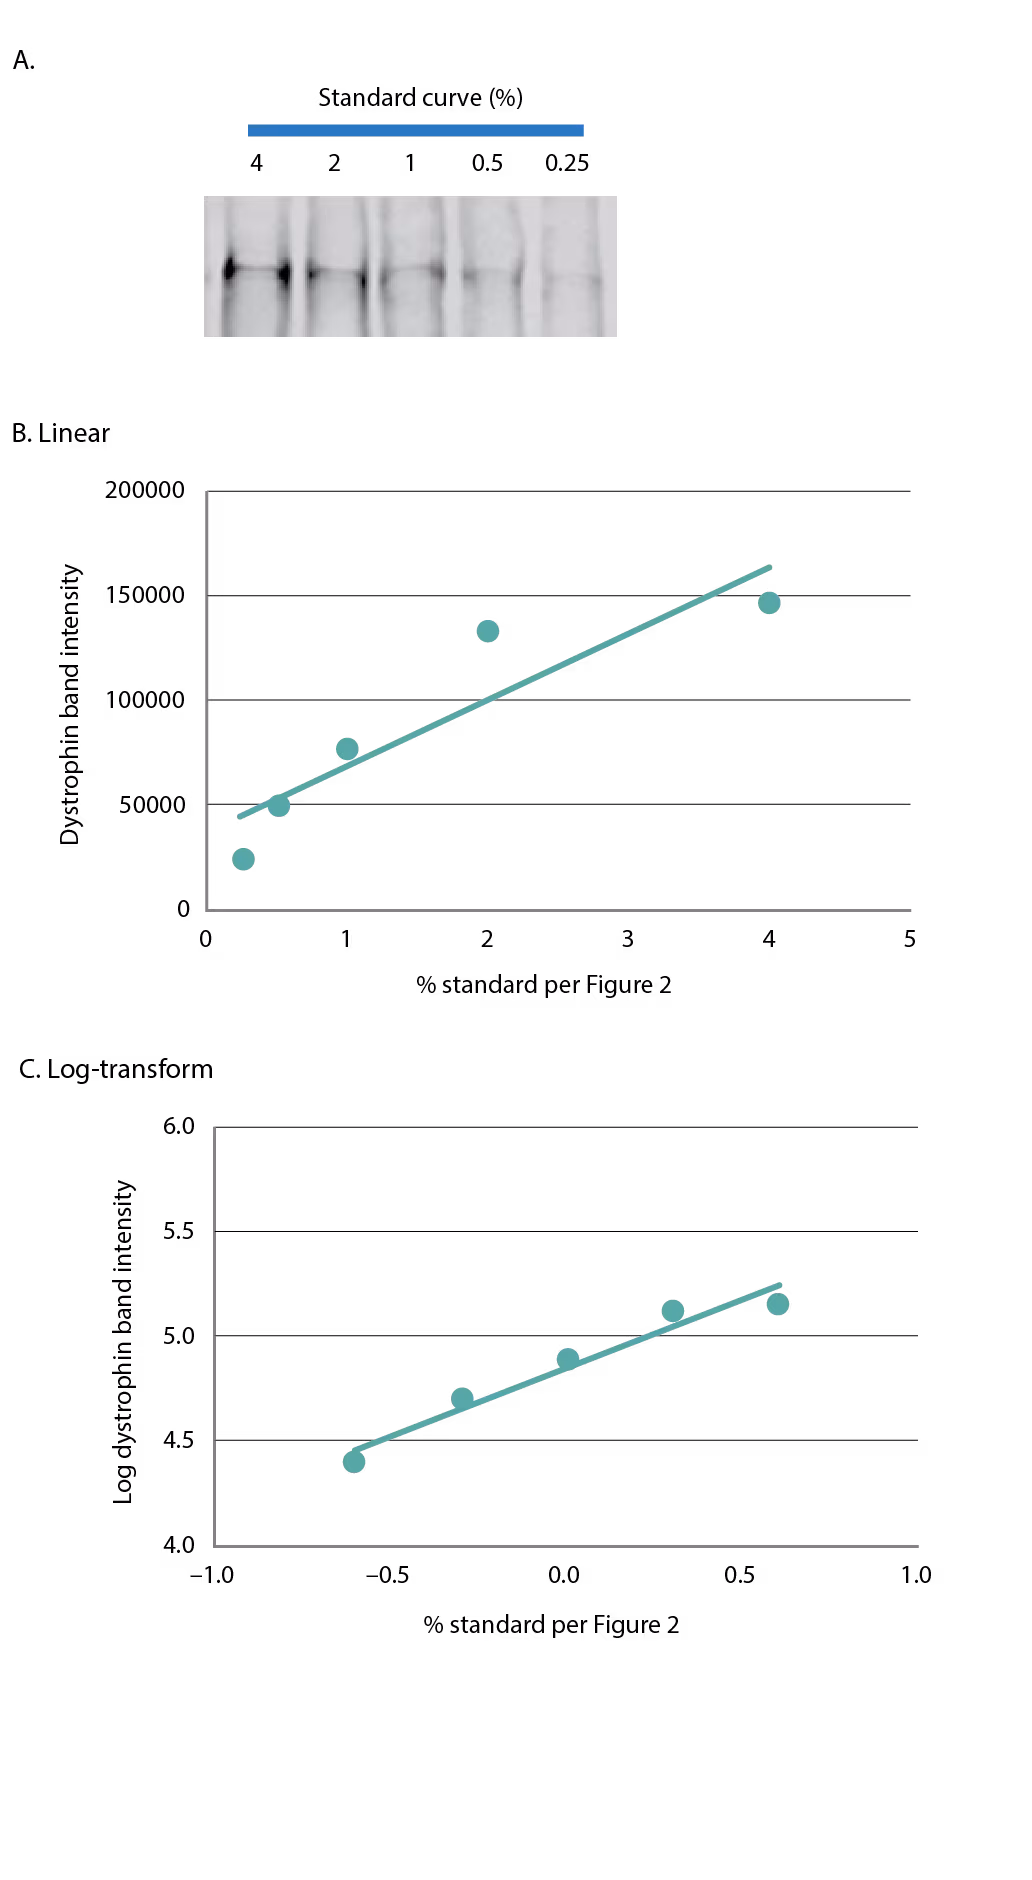
We have found similar problems in overestimating dystrophin using saturated single-point standards. Use of a multipoint standard curve allows for more accurate quantification and provides a means by which to assess potential oversaturation on each gel. In addition, setting a stringent coefficient of determination (R2) to assess linearity of the standard curve adds to the robustness of the method. Figure 2 provides examples of western blots routinely utilized for quantifying dystrophin by Sarepta Therapeutics. Two human samples, S1 and S2, that were run in duplicate using a 5-minute exposure (Figure 2A) or a 15-minute exposure (Figure 2B) are shown. A five-point standard curve using a healthy control was spiked into DMD lysate at levels of 4.00%, 2.00%, 1.00%, 0.50%, and 0.25%. The DMD samples used were previously screened to ensure dystrophin levels were <0.25%. A linear regression on the log-transformed data was performed to calculate the amount of dystrophin in the sample due to the non-normality of the chemiluminescence signal.27 The standard curve graphed in linear fashion and the standard curve log-transformed are shown in Figures 2C and D.
Dystrophin levels vary appreciably, depending on whether log-transformation is used. As shown in Table 1, sample S1 had an average 0.47% dystrophin when quantified using the log-transformed five-point standard curve at the 5-minute exposure (Table 1); when the data were analyzed without log-transformation using the 5-minute exposure, S1 had an average of 0.32% dystrophin, a 1.47-fold decrease in comparison to the log-transformed value. If the more saturated exposure of 15 minutes is used to quantify dystrophin, the differences between the linear and log-transformed data are even more substantial. The linear quantification (no log-transformation) represents the S1 dystrophin as non-quantifiable (<0%), emphasizing the profound impact of how data analysis can skew dystrophin quantification (Table 1). Analyzing chemiluminescent detection of dystrophin without log-transforming the data does not always lead to a reduction in dystrophin quantification. Sample S2, when analyzed without log-transformation, increased using both 5-minute and 15-minute exposures when compared with the log-transformed data (Table 1). To achieve the most accurate dystrophin, one should avoid saturation of the top end of the standard curve while also maintaining adequate signal at the bottom end of the standard curve.
Another concern for dystrophin quantitation is both method and biological variability. Even well-performing methods have a certain amount of inherent variability, which requires multiple technical replicates to be run to increase the accuracy of the measurement. During an assessment of dystrophin amounts in patients on eteplirsen, using duplicate gels as technical replicates, the average coefficient of variation was 16% (data not shown).1 Biological replicates were not conducted for this study but for future studies, based on regulatory guidance from the FDA, two biopsies for both pre- and post-treatment are now assessed. Therefore, each patient has a total of eight data points from the western blot assay (pre- and post-treatment biopsies x two biological replicates x two technical replicates).
Many of the early calculations of dystrophin levels in patients with BMD or DMD were “quantified” using a single-point standard, whereby the percent dystrophin was calculated according to the differences in raw band intensity.5–11,18 Using S1 as an example from Figure 2, if the 0.47% S1 sample is quantified using a single-point 4.00% standard at the more saturated 15-minute exposure, the level of dystrophin is 1.56%, a 3.32-fold increase over the log-transformed standard curve calculation (Table 1). This example used a single-point standard that was within an order of magnitude of the test sample (0.47% test sample versus 4.00% standard). The over-estimation of dystrophin would be further exacerbated if the single-point standard had markedly higher levels of dystrophin than the test sample, such as when the reference sample was loaded at 100%.28 This demonstrates that single-point reference samples cannot be reliably used to quantify levels of dystrophin in test samples. According to results presented here, it can be inferred that reports of BMD and DMD dystrophin amounts using a single-point control likely overestimated the amount of dystrophin present in these biopsies.
The composition of the standard curve can also impact dystrophin quantitation. We used a five-point standard curve ranging from 5.00–80.00% of a healthy control sample and found a DMD baseline biopsy, that was quantified using a linear regression on log-transformed data, had 1.19% dystrophin. This is much higher than any baseline biopsy we have encountered using a 0.25–4.00% standard curve. This shows that the standard curve alone can greatly impact apparent dystrophin quantification. Further, if these same data were analyzed using a quadratic equation, dystrophin increases from 1.19% to 2.50%. Taken together, the composition of the standard curve and the regression analysis performed can drastically impact the quantification of dystrophin. Furthermore, regression analyses that truly assess the linearity of the standard curve should be used rather than equations that integrate with a high coefficient of determination, regardless of the data.
Muscle content normalization
It is common practice when quantifying a protein by western blot to confirm equal protein is loaded in each lane of the gel, often referred to as a loading control or muscle content marker.29 Some methods also incorporate a normalization step such that the amount of dystrophin in the sample is normalized to the amount of the protein found in the loading control.24 For example, if a patient biopsy were to have 1% dystrophin compared with the healthy control reference and the loading control showed only 50% loading control signal compared with the healthy control reference, then this sample could be reported to have 2% dystrophin (1% dystrophin/0.50 loading control = 2% dystrophin). Implementing muscle content assessments is essential to fully understand the level of efficacy for dystrophin-restoring therapies. However, the development of a robust and reproducible method for the quantification of the muscle content protein is as crucial as it is for dystrophin quantitation.
The most straightforward way for muscle content quantification is to detect the muscle protein on the same membrane that is used to quantify dystrophin, either through multiplex detection or as a secondary readout after dystrophin detection. The main issue with this method is that dystrophin is a large, membrane-bound, rare protein in muscle while other muscle proteins routinely assessed are typically present in much higher abundance, and are much smaller and/or more easily extracted. Therefore, the amount of protein required to sensitively quantify dystrophin likely will lead to oversaturation of the loading control proteins and may exceed the binding capacity of the transfer membrane.
Another issue with multiplexing when quantifying muscle protein is that the standard curve that produces the dystrophin signal is predominantly composed of lysate that is not from the reference sample.1,21,23,24 In other words, most standard curves are generated by spiking a control or reference sample lysate into DMD lysate. Therefore, most of the muscle proteins assessed in the standard curve are from the DMD lysate, not the reference sample lysate. The goal for quantifying muscle content in patient lysates using a validated assay should be to develop a separate method that can measure small changes in a muscle-specific protein. When developing a validated method to assess muscle content, care should be taken to verify the resolution of the method and the use of a standard curve should be considered imperative. Alternatively, if a separate muscle content assay is not implemented, then the muscle protein should only be used for quality control purposes rather than as a normalizing factor for dystrophin amount, as suggested by TREAT-NMD/World Duchenne organization meeting for dystrophin quantification methodology.3
Fluorescent-based western blot detection of dystrophin
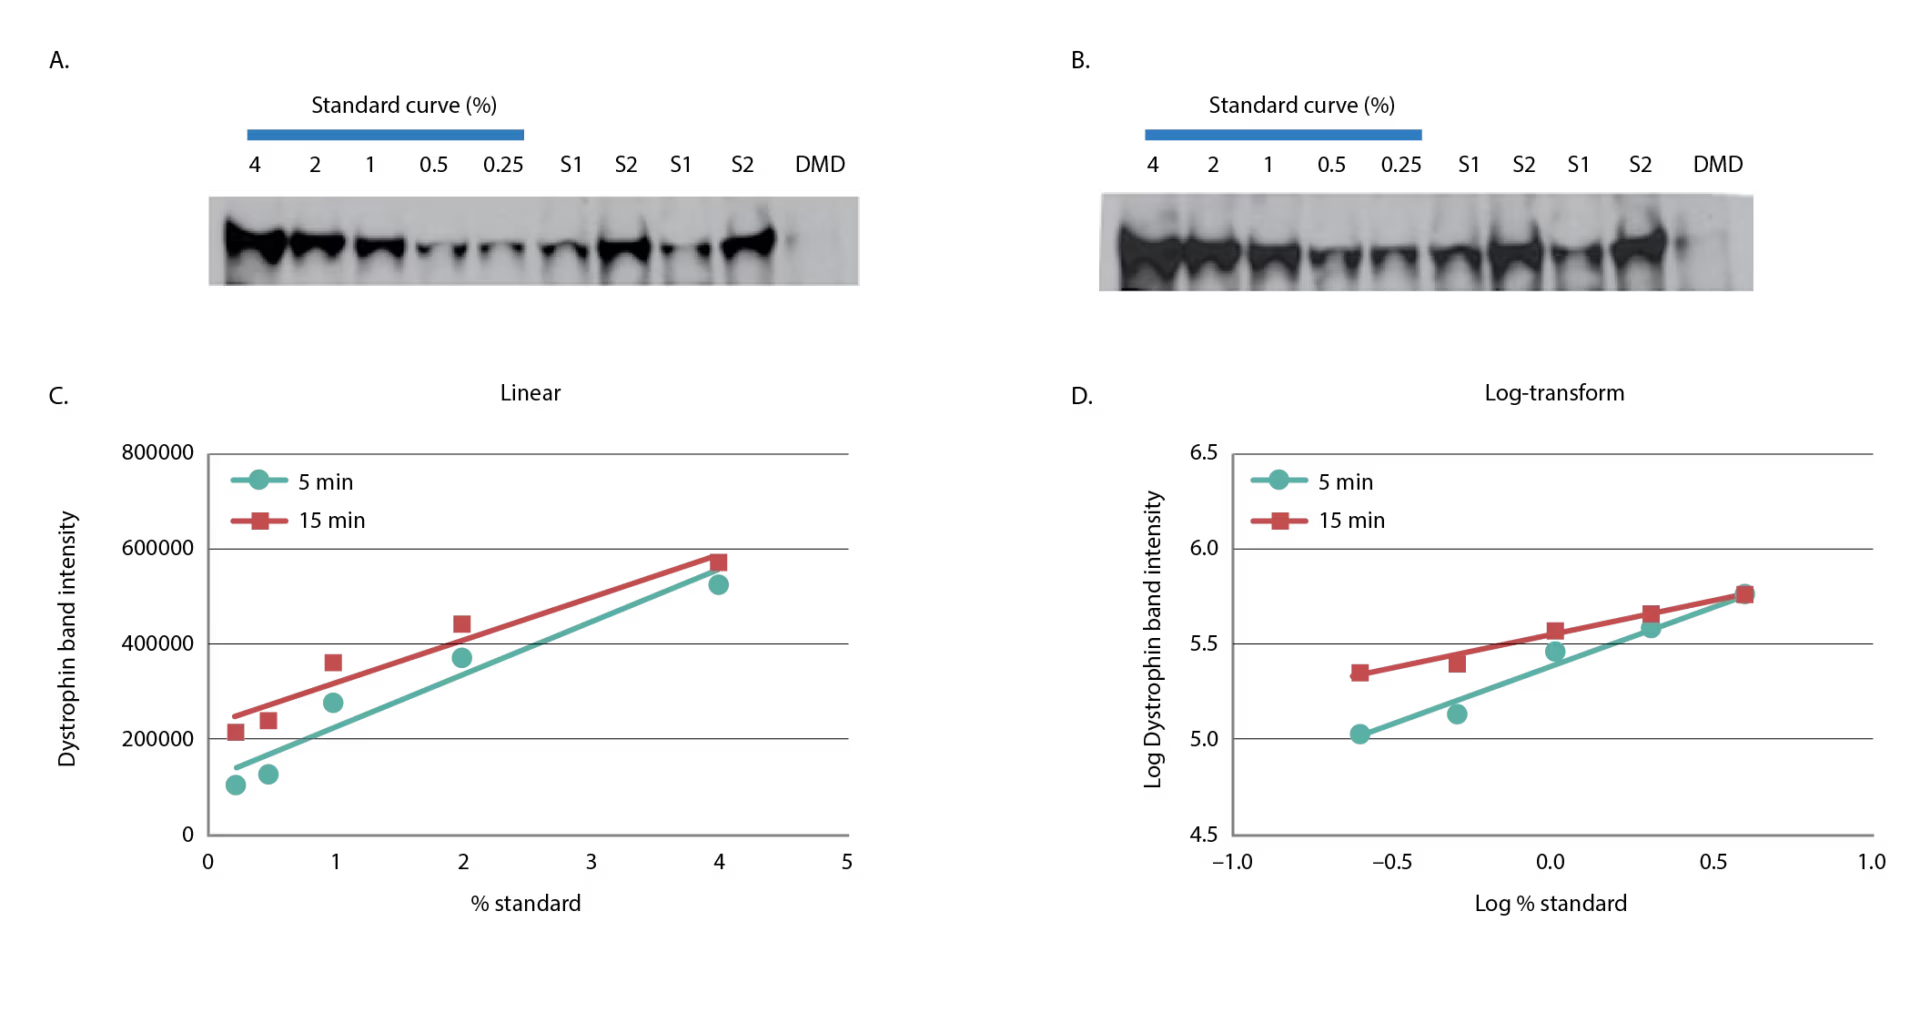
Fluorescent-based dystrophin detection has the promise of being more reproducible with greater linearity, given the non-enzymatic detection of dystrophin.30 Preliminary testing by our group showed good sensitivity using near infrared fluorescence with detection of 0.25% compared with healthy control (Figure 3A), and yet, the linearity of the curve was no better compared with chemiluminescence, and saturation occurred at the top end of the curve (Figures 3B and 3C). Quantitation of dystrophin using a single-point standard with the standard curve in Figure 3 would lead to an over- or under-estimation of sample dystrophin levels, depending on whether the amount of dystrophin in the standard is higher or lower than the sample. Further, the use of a linear-regression on the fluorescent standard curve from Figure 3B without log-transformation could inappropriately assess dystrophin. With further testing and development of fluorescent-based quantitation of dystrophin it is possible that the method could become more linear and robust. It is imperative when analyzing western blot data with a standard curve to understand how the data are distributed to best fit the curve, regardless of the detection system. To best determine the regression analysis, multiple gels should be run over several days and the totality of the data should be analyzed.
Mass spectrometry quantification of dystrophin
Mass spectrometry methods have been developed that can reproducibly detect as little as 5% dystrophin protein compared with a healthy muscle reference.13,31 We tested a liquid chromatography–mass spectrometry (LC–MS) method for the quantification of dystrophin and initial results showed excellent sensitivity with limit of detection of 5 ng/mL. Untreated DMD biopsies ranged from 26.0–37.5 ng/mL and a healthy control sample was found to have 521.8 ng/mL dystrophin (Table 2). Dystrophin in the DMD biopsies, using this method would equate to between 5.0–7.2% the level of dystrophin of the healthy control sample. However, when a series of lysates were constructed using wild-type mouse muscle spiked into lysate from mdx mice to create a range of dystrophin representing 0–8% wild-type, it became clear that the resolution of the method under 2% wild-type was not ideal (Table 3). The coefficient of variation values were all <12 showing good reproducibility; however, a lysate containing 0.25% wild-type could not be discerned from a lysate containing 1% wild-type. The inability of LC–MS to resolve differences in dystrophin <5% has also been reported by others.3 As is the case with any dystrophin quantification method, a dystrophin LC–MS method should be examined for the ability to resolve changes in dystrophin in the range that is reported.
Conclusions
As additional dystrophin-restoring therapies are tested in humans, a greater need exists to understand the significance of those reported numbers; in order to do this, we need to thoroughly scrutinize the robustness of the methods used to measure dystrophin. To emphasize the need for validated methods of dystrophin quantification, the S1 sample in Figure 2 was originally quantified as 0.46% with a log-transformed five-point standard curve and a 5-minute exposure. This value could be quantified as high as 28.1% if poorly controlled methods were used with standards that were on the low end of the dystrophin range (Figure 4). Even with well-developed methods using standard curves to quantify dystrophin, subtle protocol differences can have profound impacts on final quantitation. As an example, a patient administered eteplirsen 2 mg/kg weekly for 12 weeks in a phase II dose-escalation study showed 18% dystrophin using a standard curve ranging from 1–10% of control.20
The highest dystrophin reported after 180 weeks of treatment with eteplirsen at 30 mg/kg was 2.47% of control.1 The latter study used the focused 0.25–4.00% healthy control standard curve that once again demonstrates that subtle differences in the method can have a profound impact on the numbers.
It remains extremely complicated to compare dystrophin values across studies when different standards and methods are used. To aid the Duchenne community, Table 4 provides some recommendations when setting up a quantitative western assay. However, dystrophin quantitation will remain relative without a commercially available standard and detection kit. The TREAT-NMD/World Duchenne organization meeting on quantification methodology confirmed that industry labs developing quantitative western blot methods for dystrophin have significant differences in protocols used.3 Unfortunately, this precludes direct comparisons of dystrophin data across different studies when different methods are used. Perhaps the use of more automated technologies such as the ProteinSimple Wes will remove enough method variables to allow more direct comparisons. ProteinSimple Wes has several advantages over the traditional western blot method, including: 1) much smaller protein loads, which requires less tissue; 2) increased automation, which should allow for better standardization across multiple sites; and 3) higher throughput, which will allow for increased biological and technical replicates for increased accuracy. Beekman et al. presented a detailed ProteinSimple Wes method that should be transferable between labs along with a thorough survey of healthy, BMD, and DMD biopsies as a benchmark to assess method accuracy.15 Furthermore, the TREAT-NMD/World Duchenne organization meeting suggested a primary reference standard be shared by all groups to allow for the selection of a healthy control standard that expresses the same amount of dystrophin.3 However, until more widespread use of the ProtienSimple technology is implemented and until a ‘universal’ dystrophin reference standard is available, the fold-increase in dystrophin expression from baseline is currently the most meaningful measure of treatment outcome. ⬛
Figure 1: Dystrophin variation across individuals and muscle type
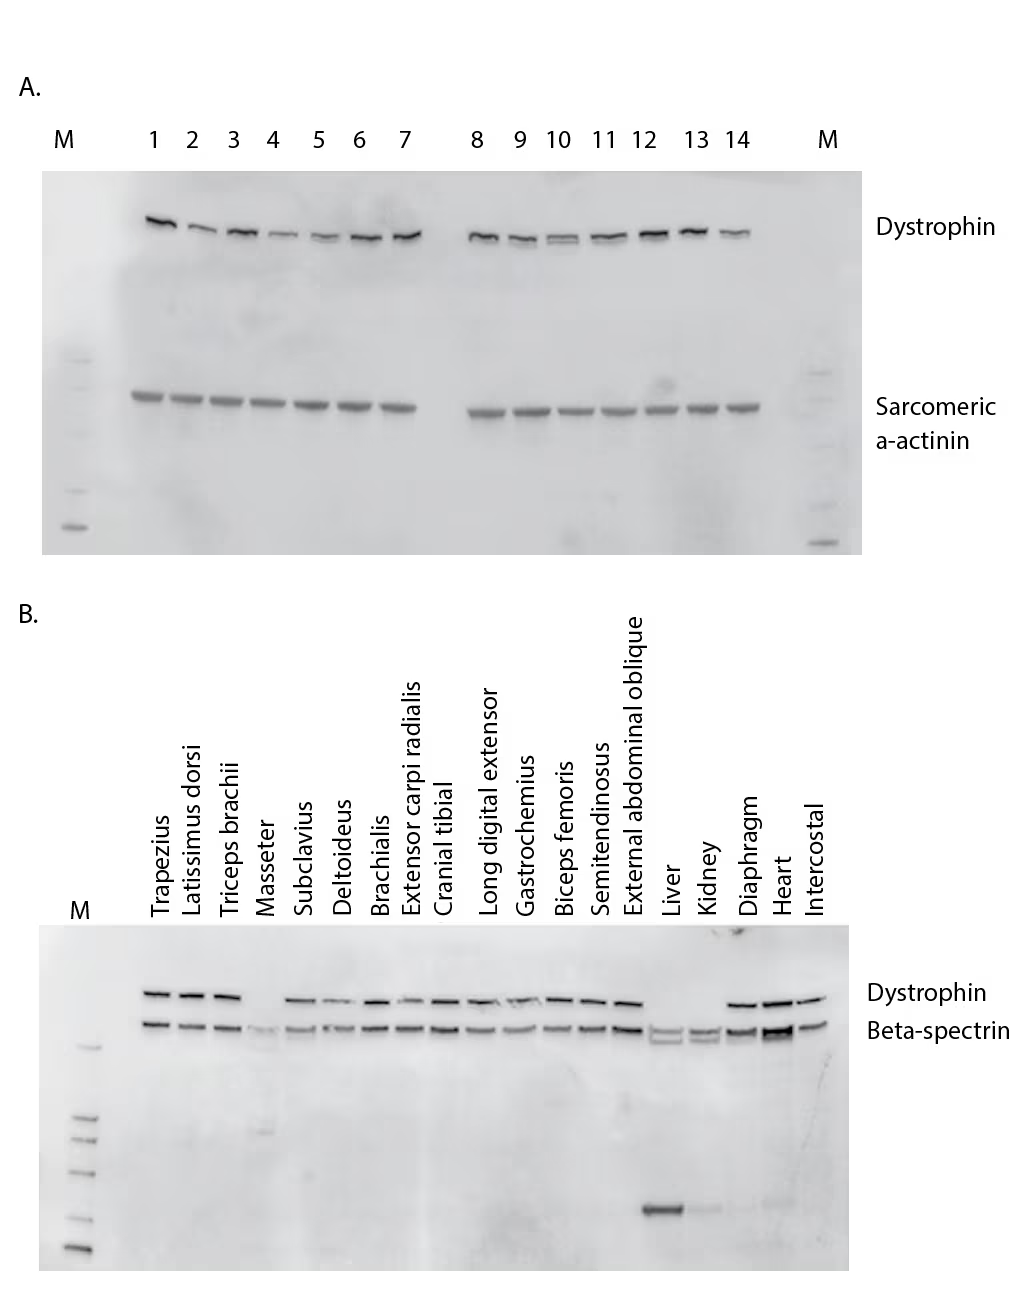
(A) Western blot comparison of dystrophin levels from 14 non–DMD/BMD individuals aged 17–58 years who underwent elective procedures. Sarcomeric α-actinin was probed to observe muscle content amounts. (B) Tissue survey from a healthy young male pig comparing dystrophin amounts. Beta-spectrin was also probed to understand muscle content and proteolysis.
BMD = Becker muscular dystrophy; DMD = Duchenne muscular dystrophy; M = marker
Figure 2: Linearity of dystrophin signal using chemiluminescence
A five-point standard curve was constructed by spiking-in healthy control lysate from quadriceps into DMD lysate from biceps to produce 4.00%, 2.00%, 1.00%, 0.50%, and 0.25%. Two samples were assessed for dystrophin duplicate and the DMD lysate used to construct the standard curve is shown. Five-minute (A) and 15-minute (B) exposures are shown. The dystrophin band signal of the five-point standard curve was graphed in linear (C) or log-transformed (D) format.
DMD = Duchenne muscular dystrophy; S = sample.
Figure 3: Fluorescence detection of dystrophin
(A) A five-point standard curve was constructed as in Figure 2 and dystrophin was detected using fluorescence-based imaging. The five-point standard curve is graphed in (B) linear format, or (C) log-transformed.
Figure 4: Dystrophin quantification can be drastically changed based on non-optimized standards and analysis parameters
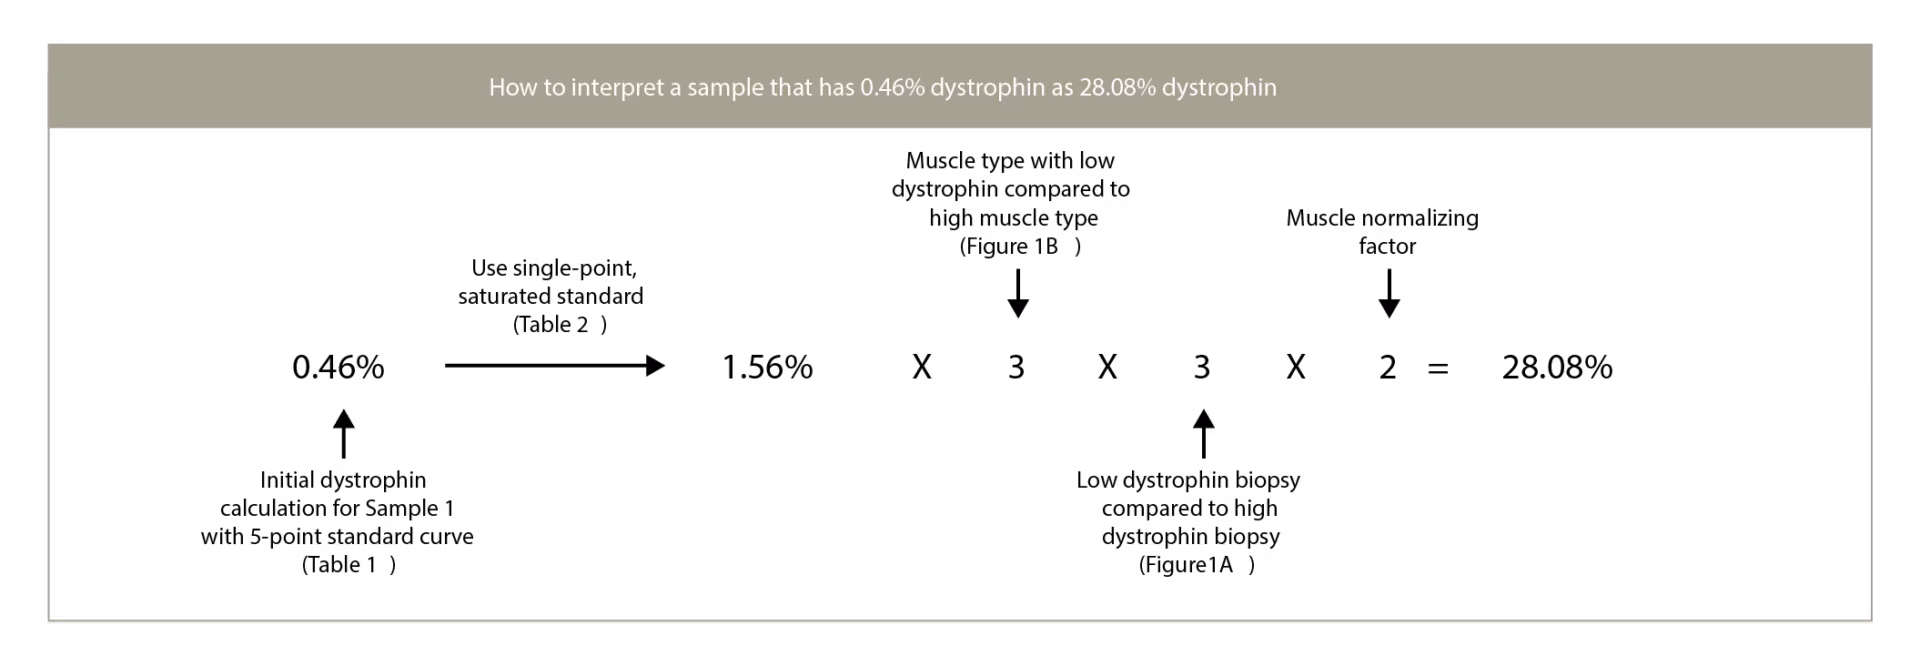
A DMD lysate that has been quantified as 0.46% using a high-dystrophin standard with optimized analyses could be quantified as 28.08% if a low-dystrophin single-point standard is used with a correction factor based on muscle content.
Table 1: Percent dystrophin calculated from a 5-minute exposure
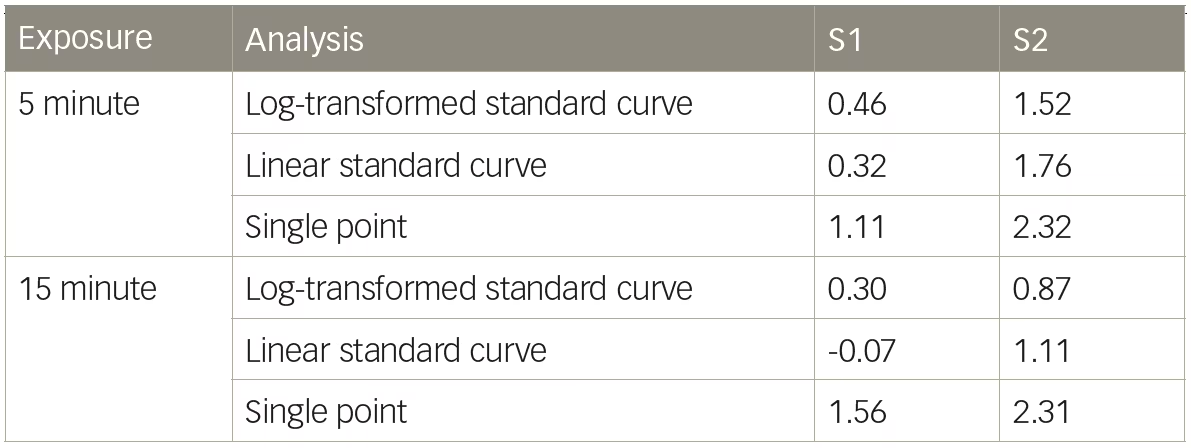
S = sample.
Table 2: Liquid chromatography–mass spectrometry quantification of dystrophin in humans
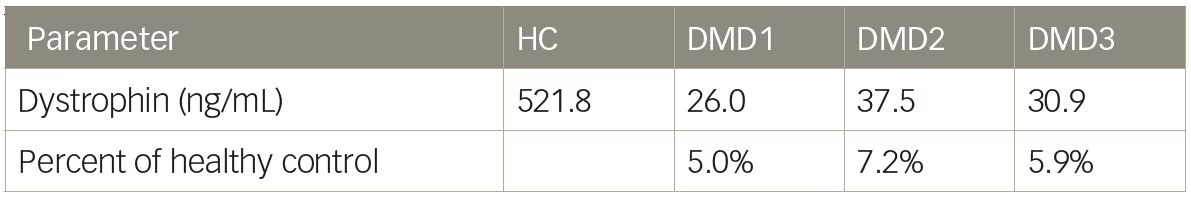
DMD = Duchenne muscular dystrophy; HC = Healthy control.
Table 3: Liquid chromatography–mass spectrometry quantification of dystrophin in mouse model
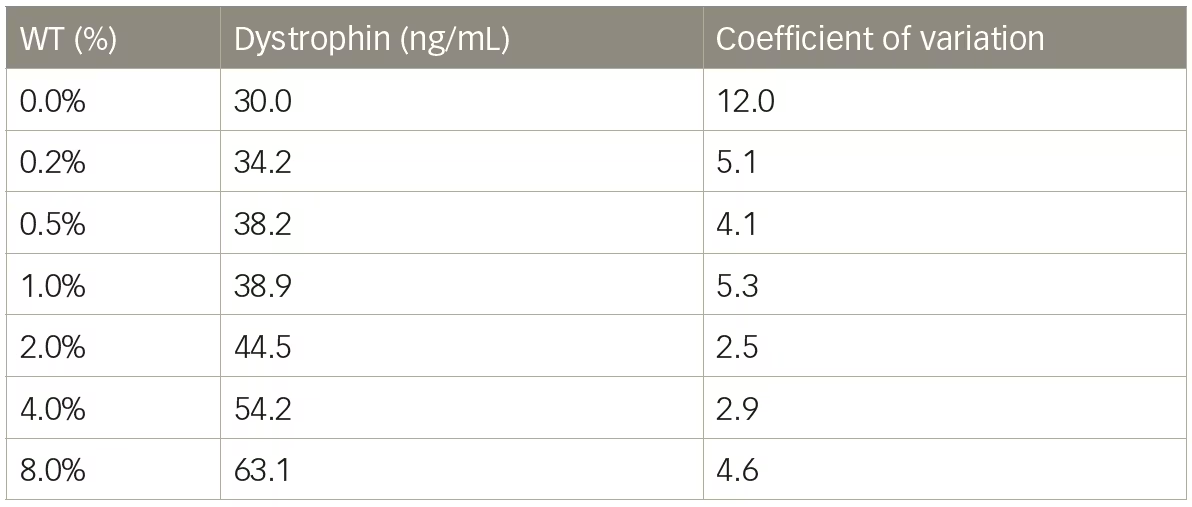
WT = wild type.
Table 4: Recommendations for setting up a quantitative western assay
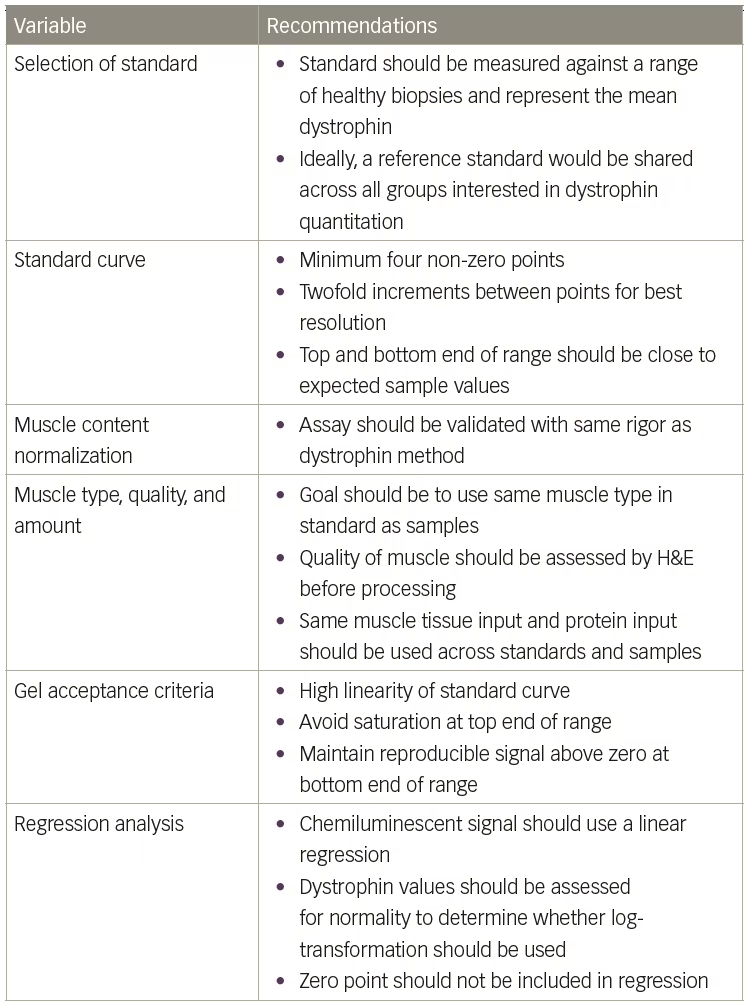
H&E = Hematoxylin and Eosin