Stroke is the leading cause of adult disability and the second leading cause of death in developed countries.1 Despite progress in stroke treatment, 20–30 % of strokes result in death within one month and 70–80 % result in significant long-term disability.2–4 Improved preventative and acute management of cerebrovascular disease has reduced stroke-related mortality;5 however, many stroke survivors remain impaired with nearly 33 % institutionalised after stroke.6–9
Neuroimaging is a critical component of patient care in all stages of cerebrovascular disease: from identification of stroke risk factors to stratifying acute and chronic stroke patients to the most effective revascularisation and rehabilitation treatments. Evaluation of management decisions and post-stroke therapy strategies would be accelerated with an improved understanding of the complex interplay between vascular, neurochemical and tissue-level haemodynamic impairment.
Characterisation of soft-tissue structure using fluid attenuated inversion recovery (FLAIR) and T1-weighted magnetic resonance imaging (MRI) is central to most standard MRI protocols and extensive work has documented the relevance of these techniques.10–12 In more specialised protocols, diffusion weighted imaging (DWI) or diffusion tensor imaging (DTI) can be applied to characterise membrane integrity and fibre tract directionality, respectively,13 and neurochemical tissue signatures can be assessed using principles of magnetic resonance spectroscopy.14 These relatively well-known approaches have been implemented in patients with cerebrovascular disease for more than two decades. However, newer approaches are continuously being developed that hold potential for further expanding our understanding of the functional and structural sequelae of tissue changes during and following ischaemia.
Here, we review the state of novel, non-invasive MRI approaches capable of complementing the existing stroke imaging infrastructure for more comprehensive evaluation of cerebrovascular disease. As each method is in a different stage of development, with varying timelines for routine clinical implementation, the purpose of this article is to review these emerging methods in the context of their strengths and limitations for evaluating cerebrovascular disease and to provide references relevant for further evaluation of their existing impact on stroke imaging (see Table 1).
Magnetic Resonance Imaging
MRI has been routinely used clinically for more than 20 years, with a primary purpose for visualising structural soft-tissue contrast. The main signal source in MRI is water and the contrast derives from how the magnetic properties (longitudinal and transverse relaxation times: T1 and T2, respectively) of water protons in different environments adjust in the presence of a static magnetic field (B0; generally 1.5–3.0 Tesla) following perturbation by additional radiofrequency (B1) and gradient (G) fields. Water protons in different environments have unique relaxation properties and therefore can exhibit exquisite contrast between different healthy tissue types and between healthy and diseased tissue. Importantly and unlike contrast derived from positron emission tomography (PET), single-photon emission computed tomography (SPECT) or computed tomography (CT), different contrasts in MRI can be generated simply by adjusting scan parameters (e.g., B1 and G). This accelerates innovation and clinical implementation in MRI, as testing or approval that may be required from new exogenous tracers is irrelevant. However, a valid concern with MRI is that our ability to validate new techniques may be outpaced by diverging technical innovations. When this occurs, the clinical feasibility of new MR approaches and their true prognostic potential may be unclear. Here, we present an overview of several cerebrovascular imaging methods that have tested clinical potential and which deserve interest for implementation into large-scale clinical trials.
Blood Oxygenation Level-dependent Cerebrovascular Reactivity
Blood oxygenation level-dependent (BOLD) MR neuroimaging with predominately T2*-weighted contrast15,16 and less commonly T2-weighted contrast,17 has been widely applied to map brain activity18–21 non-invasively, transforming the field of cognitive neuroscience. BOLD contrast arises owing to the mismatch in cerebral blood flow (CBF), cerebral blood volume (CBV) and cerebral metabolic rate of oxygen (CMRO2) increases secondary to both vascular and neuronal stimulation in healthy parenchyma.22 Specifically, CBF increases by generally 20–100 % (depending on task), whereas CMRO2 increases only marginally by 0–20 %.23,24 This leads to an increase in oxyhaemoglobin (HbO2) relative to deoxyhaemoglogin (Hb) in capillaries and veins. As HbO2 is diamagnetic whereas Hb is paramagnetic, the relative reduction of fractional Hb in the vasculature will increase surrounding water T2 and T2*, thereby increasing MR signal. Additional dephasing arises from CBV increases in vasculature containing Hb, which will reduce the surrounding water signal.25,26
BOLD MR was initially developed to assess changes in blood flow as a surrogate for neuronal activity, allowing functional localisation. BOLD signals are indirect markers of neuronal or vascular activity that arise consequential to modulations in haemodynamics and metabolism,20,21,27–34 In healthy tissue, coupling between these parameters are frequently preserved and therefore it is possible to make inferences regarding both haemodynamics and metabolism from ensemble BOLD signal under certain assumptions. However, when imaging diseased tissue, uncoupling between flow and metabolism, together with autoregulation complicates interpretation of the BOLD signal.22,35
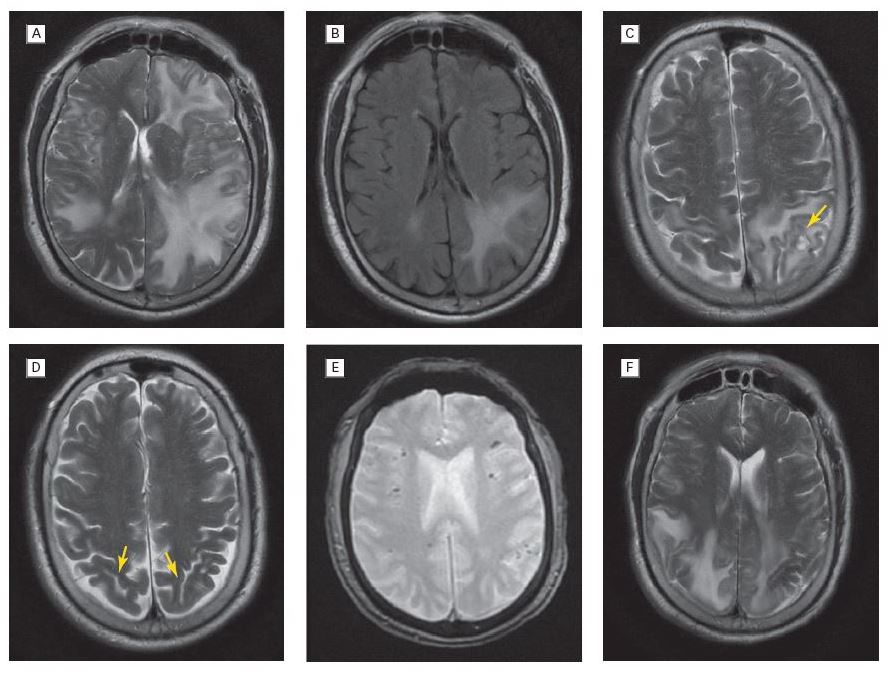
Recently, BOLD imaging has been utilised in studies of cerebrovascular disease in conjunction with primarily isometabolic hypercarbic gas stimulation.36,37 Here, hypercarbia (generally ~5 % CO2) is administered either with a balance of atmospheric air or O2.38 The hypercarbic stimulus elicits relaxation of arterial smooth muscle and correspondingly increases in CBF and CBV. Therefore, the hypercarbic-induced BOLD signal is a marker of cerebrovascular reactivity (CVR) and the degree of increases in BOLD signal can be used to infer how near vasculature is to reserve capacity. This method has been used clinically in a range of patients with cervical and intracranial steno-occlusive disease39–41 and BOLD-measured CVR has been shown to correlate with angiographic and clinical measures of impairment,40 inversely with cortical thickness42 and variably with prognosis and stroke risk.43,44 Figure 1 shows an example of how BOLD CVR can be used clinically to provide additional information regarding parenchyma response to surgical revascularisation.
The advantages of BOLD CVR measurements are (i) a large existing literature demonstrating clinical feasibility, (ii) the non-invasive nature of the MRI protocol, which does not require intravenous contrast and (iii) simplicity of the imaging sequence (most commonly a wholebrain long echo time single-shot echo planar imaging acquisition). The disadvantages are (i) susceptibility artefacts around regions of air/ tissue interface in lower frontal lobe, (ii) contraindications in patients with severe pulmonary disease and (iii) necessity to monitor basic physiological changes including heart rate, blood pressure, end-tidal CO2 (EtCO2) and preferably fraction-inspired O2. Hypercarbic BOLD has been implemented with good success using standard non-rebreathing gas masks and commercial gas mixtures, although more elaborate and controlled gas delivery equipment using end-tidal forcing and similar procedures are also utilised.45
Cerebral Blood Flow-weighted Arterial Spin Labelling
Though arterial spin labelling (ASL) MRI is nearly as old as BOLD MRI,46 it is less widely used owing to greater technical hurdles related to acquisition. Contrary to BOLD, which provides a qualitative indirect marker for brain neurovascular function, ASL is primarily CBF-weighted, and with appropriate care can be used to quantify CBF in absolute units (millilitres blood/100 g tissue/minute), analogous to PET or CT perfusion imaging. In ASL, arterial blood water magnetisation is altered using either a single or more recently a string of radiofrequency pulses; this inverts the magnetisation of inflowing blood water relative to static tissue water. This inversion acts as an endogenous bolus. Blood water labelled in carotid and vertebra-basilar arteries travels through the large vasculature, enters the capillaries and exchanges with tissue water. Tissue signal is imaged after an adequate post-labelling delay time (inversion time, TI) for this capillary exchange. The labelled blood water attenuates the tissue water signal very slightly (less than 1 % of the static tissue signal) and therefore ASL generally requires a separate reference image to be acquired in which the blood water is not labelled. The difference between the label and reference image produces a CBF-weighted image and absolute quantification of CBF is possible upon application of the solution to the flow-modified Bloch equation for one (blood) or two (blood and tissue) compartments.47
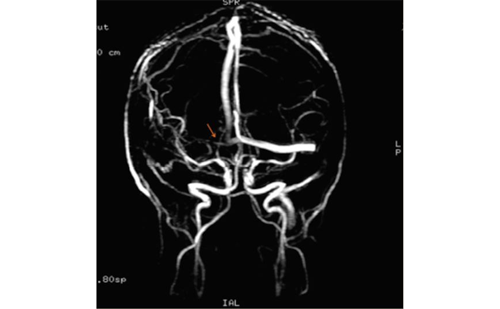
Several variants of the original ASL approach have been implemented. First, labelling can be performed using special radiofrequency transmit coils and a single, long pulse for highest SNR in the continuous ASL (CASL) method, or ASL can be performed using pulsed (PASL) or pseudo-continuous (pCASL) methods whereby a single or string of pulses are applied for labelling. Both PASL and pCASL can be performed using standard body coils for radiofrequency transmission, with pCASL providing nearly the same SNR as CASL.48 For these reasons, pCASL has recently emerged as the most popular ASL variant. Second, ASL applied at multiple post-labelling delays allows for simultaneous quantification of both CBF and arterial arrival time. When this method is repeated in the presence of bipolar gradients to dephase intravascular blood water signal, or alternatively with modelling procedures, it is additionally possible to quantify arterial CBV.49–51 Finally, one can label blood water in different feeding arteries using vessel-encoded ASL to visualise perfusion territories.52 Figure 2 outlines the ASL principles and shows an example of ASL in patients with ischaemic cerebrovascular disease. Reviews of ASL application studies53 and validation with invasive techniques37 have recently been presented and principles of spin labelling have been extended to monitor CSF54 and lymphatic flow.55
The advantages of ASL are that it is safe (not requiring intravenous contrast) and quantitative, allowing longitudinal comparison of CBF during treatment. Furthermore, when performed in tandem with BOLD MRI, it possible to enhance quantitative interpretability of functional responses by independently measuring CBF contributions to BOLD contrast, and, under appropriate modeling assumptions, infer changes in the remaining sources to BOLD contrast (e.g., CBV or CMRO2). Disadvantages of ASL are the low SNR (generally 10–20-fold lower than BOLD owing to the small effect of the blood water label) and reduced sensitivity to CBF in tissue with delayed arterial arrival times, including white matter or ischaemic tissue. The latter confound arises owing to the endogenous label decaying with the T1 of blood water, which is approximately 1.2 s at 1.5T but grows to 1.6 s at 3.0T.56,57 Arterial arrival times are generally reported in the range of 0.7–1.1 s, with an additional 1 s required for blood water to traverse the capillary bed. Therefore, ASL is more reliable at higher field strength where the blood water T1 (and in turn effective half-life of the tracer) is on the order of the blood-to-tissue transit time.
pH-weighted Chemical Exchange Saturation Transfer
While the MRI signal is almost always derived from protons on water molecules, it is also possible to indirectly image labile protons that exchange with water. One of the most popular methods for this is with amide proton transfer (APT) imaging.58,59 Whole-brain APT MRI can be obtained using standard equipment available at most hospitals and using commonplace imaging readouts optimised for structural and functional MRI. Chemical information is obtained through saturation transfer of magnetisation between amide protons (primarily on the peptide backbone; in vivo concentration = 70–100 mM) and the imaged water protons (concentration = 110 M). In APT, the labile protons originate from amide groups resonating at 8.3 ppm in the proton spectrum (+3.5 ppm from water).60 Importantly, over a physiological pH (pH >5), the exchange rate is base-catalysed and therefore the APT effect-size on the water signal reduces with decreasing pH, or tissue acidosis. As anaerobic metabolism during ischaemia leads to considerable tissue acidosis, APT may permit insight into the energy status of ischaemic parenchyma by indirect pH imaging. Sun and colleagues have demonstrated potential for this method by monitoring the evolution of pH changes following middle cerebral artery occlusion in anaesthetised rats at 4.7T.61,62.
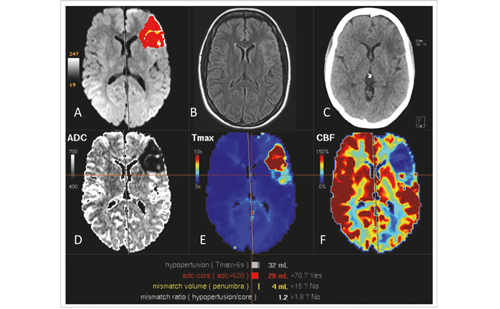
Variables predicting functional outcome following stroke include patient age, the National Institutes of Health Stroke Scale (NIHSS),63,64 the size of the infarct core65,66 and (more controversially) the presence of penumbra.67 Acute stroke intervention requires a judgment regarding the balance between revascularisation benefits and risks. Intravenous or intra-arterial thrombolysis and clot retrieval endovascular procedures have been shown to increase reperfusion rates and reduce final infarct size when administered within the first hours of symptom onset.68–70 However, reperfusing infarcted tissue increases the risk of haemorrhagic transformation, which occurs in approximately 6 % of treated patients.71 Much work has been performed to develop fast imaging tools that accurately identify both the ischaemic penumbra and the infarcted core of irreversibly damaged tissue. Clinically, this is most-often performed using perfusion CT or perfusion- and diffusion-weighted MRI (PWI and DWI). However, decreased perfusion may represent infarct core, penumbra and/or benign oligaemia.72–77 Imaging tissue acidosis may provide an additional method for characterising at risk and infarcted tissue in acute stroke.78 Figure 3 shows an example of an acute stroke patient imaged using pH-weighted APT CEST imaging.
The advantages of CEST imaging are that it is non-invasive and provides information regarding pH and macromolecular environment using typical imaging readouts already optimised from other modalities. This is in contrast to MR spectroscopy, which has been widely used for assessment of similar parameters, yet has extremely poor spatial coverage (generally one voxel) and is also time-intensive (5–15 minutes). A disadvantage of CEST imaging is that the nature of the contrast mechanism, including contributions from all exchanging species, has not been well summarised yet and therefore much development work is ongoing. Additionally, methodological CEST studies are frequently conducted at high field (>3.0T) where contrast is largest and it remains unclear how well this approach will perform at clinically available field strengths.
Arterial Vessel Wall Imaging
Cervical vascular stenosis is a well-known risk factor for stroke and much progress has been made in preventing strokes in this population. Following the North American Symptomatic Carotid Endarterectomy Trial (NASCET), patients with symptomatic high-grade cervical internal carotid artery (ICA) stenosis have been surgically revascularised with carotid endarterectomy, or more controversially, carotid stenting,79 reducing stroke incidence. Recently it has been shown that patients with IC stenosis are also at high risk for stroke,80 but the appropriate treatment for IC stenosis is less clear in the wake of the recently halted Stenting and Aggressive Medical Management for Preventing Recurrent Stroke in Intracranial Stenosis (SAMMPRIS) study.81,82 In this prospective trial, 14 % of patients treated with angioplasty combined with stenting and medical management experienced a stroke or died within the first 30 days following treatment compared with 5.8 % of patients who received medical management alone.
Arterial wall imaging of intracranial vessels is important for defining vulnerable plaque features, which have not been characterised for intracranial atherosclerotic disease and for improving management decisions. Much more is known about coronary and carotid bifurcation risk factors. For instance, nearly 70 % of acute coronary events are caused by lesions that are not haemodynamically significant or flow limiting prior to the event.83 Carotid bifurcation studies have reported morphological plaque features are more predictive of stroke risk than luminal stenosis.84 Vulnerable extracranial plaque features, which have been validated in prospective studies and correlate with histopathological findings following carotid endarterectomy, include lipid-rich necrotic cores, intraplaque haemorrhage and torn fibrous caps. Improved understanding of the longitudinal progression of atherosclerosis has shown that early plaque is accommodated by external remodelling without luminal ompromise, presumably in an attempt to preserve haemodynamic flow. Studies have demonstrated plaque burden and composition is a dynamic process, which can increase or decrease with time.85 Results from the recently completed Trial of Cilostazol in Symptomatic intracranial Stenosis 2 (TOSS-2) suggest MR may be sensitive to plaque changes in response to treatment.86 Preliminary findings of vulnerable intracranial plaque features on MRI include eccentric wall enhancement and intraplaque heterogeneity, which appears to correlate with embolic infarct patterns and ipsilateral stroke.
Once vulnerable plaque features are validated, the effects of current treatments, including anti-platelet therapy and statins, on plaque morphology could be monitored longitudinally with arterial wall imaging, which has recently been developed and studied in healthy volunteers and patients with cerebrovascular disease, utilising ultra-high spatial resolution methods.67–70 The general strategy in these methods is to null intravascular signal and CSF signal, revealing contrast between the vessel wall and the surrounding nulled regions.67 This can be achieved using a long turbo spin echo readout that will poorly refocus flowing spins through the region of interest, together with an inversion pre-pulse to null the longitudinal component of the blood water magnetisation. Other methods with similar goals exploit pulse trains in combination with a train of spoiler gradients.87 Figure 4 shows an example of vessel wall imaging in a patient with intracranial stenosis. The disadvantage of vessel wall imaging without contrast agents is that such protocols require sub-millimetre imaging of 0.5–0.8 mm to resolve vessel walls. Due to inherently low SNR at clinically available field strengths, this can necessitate 7–12 minutes of scan time. While feasible at a clinical field strength of 3.0T, the improved non-invasive vessel wall contrast has been reported at ultra-high field.
Ultra-high Field Relevance
Clinical magnetic field strengths are now common at both 1.5T and 3.0T, and approximately 50 research centres worldwide have 7.0T scanners. SNR increases linearly with field strength88 and thus identical spatial resolution is available in approximately half the scan time if the identical scan is performed at 3.0T compared with 1.5T. While SNR improvements are the most common impetus for moving to higher field (see Figure 4), additional beneficial changes in contrast occur as well. For instance, BOLD MRI contrast is extremely sensitive to draining veins, which carry elevated HbO2 during periods of neuronal and vascular stimulus. These cortical veins cause large susceptibility changes and therefore measurable increases in the T2(*)-weighted signal, which is not derived from vascular reactivity and may not co-localise with the functional area of interest. However, as magnetic field strength increases, the intravascular blood water T2(*) reduces relative to the extravascular tissue water T2(*), which should reduce artifactual contamination from draining veins when BOLD is performed at higher field. At 1.5T, 3.0T and 7.0T the fraction of the BOLD effect that is extravascular is 0.54, 0.78, and 0.92, respectively.89
Unlike T2(*), blood water T1 will increase with increasing magnetic field strength.57 This phenomena is particularly important for ASL, as the duration of the blood water label is proportional to the T1. Mean blood water (arterial and venous) T1 is approximately 1.2 s, 1.6 s and 2.3 s at 1.5T, 3.0T and 7.0T. Therefore, at 3.0T or higher ASL has increased potential for measuring CBF and arterial arrival times in tissue with reduced velocity and delayed arrival times, as is frequently the case in patients with vascular occlusion or severe stenosis (see Figure 4).
High field is particularly well-suited for APT imaging as water relaxation time lengthening, increased SNR and spectral dispersion at high field facilitates increased sensitivity to the chemical exchange effect at the time of imaging. There are very few drawbacks to performing clinical MRI at 3.0T relative to 1.5T, with the exception of implanted medical devices that may be contraindicated at higher field. However, this limitation is becoming less burdensome as more devices have been tested and approved at 3.0T. At 7.0T, very few medical devices have been tested and at many research centres, medical implanted devices of any kind are contraindicated. This substantially reduces the clinical relevance of 7.0T in the short term. Related to this concern, the specific absorption rate (SAR), defined as the RF power absorbed per unit mass, increases with increasing B0. This occurrence leads to increased heating and related safety concerns at high field, imposing limitations on pulse sequences that require short TR and high RF duty cycle (e.g., pCASL or pulse train CEST). More efforts are underway to evaluate the safety of implanted devices at 7.0T and the range of acceptable SAR constraints, however aside from promising reports of 7.0T feasibility, utilising 7.0T as a meaningful clinical tool has not yet been achieved in most centres.
Conclusions and Summary
Multiple non-invasive MRI approaches for evaluating tissue- and vascular haemodynamic impairment have been tested clinically. These include BOLD MRI for cerebrovascular reactivity evaluation, ASL for CBF quantification, CEST for pH-weighted contrast and AWI for vessel wall and plaque characterisation. The most advanced of these approaches in terms of clinical implementation are BOLD CVR and ASL CBF, with primarily feasibility testing having been performed in the remaining approaches. Finally, as all methods benefit greatly with increased magnetic field, 3.0T is essentially required and 7.0T even more promising once technical obstacles of ultra-high field imaging are addressed.