Stroke is the third leading cause of death in the US, affecting approximately 795,000 patients annually.1 A recent analysis shows that only 3–5% of acute stroke patients actually receive intravenous thrombolytic therapy.2 An important cause of non-treatment is the strict time criteria for acute medical and interventional therapies: many acute stroke patients are ineligible for treatment due to uncertainty in time of onset or delayed presentation.
Stroke is the third leading cause of death in the US, affecting approximately 795,000 patients annually.1 A recent analysis shows that only 3–5% of acute stroke patients actually receive intravenous thrombolytic therapy.2 An important cause of non-treatment is the strict time criteria for acute medical and interventional therapies: many acute stroke patients are ineligible for treatment due to uncertainty in time of onset or delayed presentation.
The use of strict time criteria to make treatment decisions is not ideal since there are significant differences among individuals and their responses to an acute vascular event.3 The goal of advanced neuroimaging is to individualize acute stroke treatments based on assessment of tissue viability and vascular status rather than using strict time criteria alone. Acute intervention or treatment may be refined through improved selection of subjects likely to benefit balanced by the risk of potential harm, irrespective of the time of presentation.3 Multimodal computed tomography (CT), including non-contrast CT (NCT), CT angiography (CTA), and CT perfusion (CTP), is increasingly available and may serve as an ideal tool for rapid image evaluation and triage of the stroke patient.
The goal of a multimodal CT protocol in acute stroke is to answer four key questions:4
• Is there hemorrhage?
• Is there occlusion of a proximal artery or intravascular thrombus that can be targeted for thrombolysis?
• Is there a core of critically ischemic irreversibly infarcted tissue?
• Is there a penumbra of ischemic but potentially salvageable tissue?
The first question is readily addressed by NCT and the second question is addressed by CTA. The last two questions are the most challenging and may potentially be addressed by CTP.5
Technique
The first component of the multimodal CT acquisition is the noncontrast head CT. Axial images through the brain are obtained in a plane parallel to a line drawn from the orbital floor to the external auditory meatus using 120kVp, 300mA, and a 23cm field of view. Next, the perfusion scan is performed with injection of 50ml of intravenous iso-osmolar non-ionic iodinated contrast at 5ml/second. The use of iso-osmolar contrast agents as opposed to low-osmolar contrast agents is preferred in order to minimize nephrotoxity.6,7 This is important because the patient’s baseline renal function may not be available at the time of the emergent scan and there may be potential for the patient to receive additional iodinated contrast if endovascular intervention is needed. With our current 64-channel CT scanners, perfusion imaging is performed at six axial 4.8mm-thick slices centered above and below the caudate head. Images are obtained with 80kVP and 120mA for 45 seconds. Finally, a CTA of the brain and neck is performed with intravenous injection of 100ml of contrast at 3ml/second utilizing a 120kV and 300mA technique and bolus tracking on the ascending aorta with a scan trigger of 150 Hounsfield units. Axial 0.625mm slices are obtained from the thoracic inlet to the skull vertex. The CTP and CTA images are post-processed on a separate networked workstation. On average, image acquisition, processing, and interpretation can be performed in 15 minutes.8
Non-contrast Computed Tomography
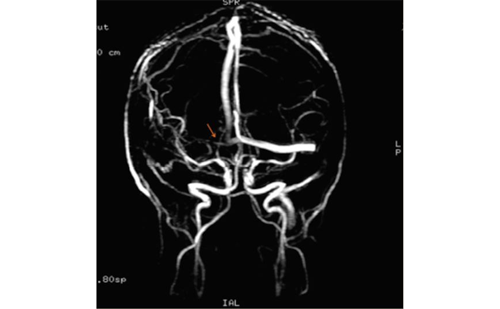
The non-contrast head CT comprises the first set of images obtained in the acquisition of multimodal CT imaging. The primary purpose of the NCT is identification of hemorrhagic stroke, which accounts for approximately 20% of all acute strokes.9 Stroke mimics such as tumor, infection, or inflammatory causes may also be detected on the noncontrast head CT. Important information regarding parenchymal changes associated with hyper-acute ischemic stroke may also be detected from the non-contrast study. In the less-than-six-hour time window from symptom onset, signs of early infarction can be seen in approximately 61–85% of patients.10,11 The appropriate use of window (W) and level (L) settings is required to detect the subtle findings associated with early ischemic changes. It is recommended that images are reviewed with both standard brain window and level settings of 40HU W/20HU L followed by repeat evaluation with a narrower setting of 20HU W/32HU L.12 Findings that have been associated with early ischemic change on CT include subtle hypo-attenuation, obscuration and loss of gray matter–white matter differentiation, cortical sulcal effacement, loss of the insular ribbon, and obscuration of the lentiform nucleus. Concomitant findings in the vessels may include hyper-attenuation of a large vessel such as ‘hyperdense middle cerebral artery (MCA) sign’ or ‘dot sign’ in an M2 branch13–15 (see Figure 1).
These early CT findings in acute ischemic stroke are helpful not only for confirming the diagnosis of acute ischemia but also useful for predicting patient outcome and response to thrombolytic therapy.16–20 For example, the hyperdense MCA sign in acute stroke patients has been associated with poor outcomes and, in some studies, failure to recanalize with intravenous (IV) thrombolytics.14,21 The extent of early ischemic change in the MCA territory also plays an important role in patient prognosis and safety of IV thrombolytics. Studies show an increased risk for symptomatic intracranial hemorrhage with IV thrombolytics when more than one-third of the MCA territory demonstrates ischemic change on an NCT.17,19,20,22,23 In order to more reliably quantify the extent of early ischemic abnormality, the Alberta Stroke Program Early CT Score was designed for the MCA territory. This system divides the MCA territory into 10 regions: caudate head, lentiform nucleus, insular ribbon, internal capsule, and anterior, middle, and posterior, superior, and inferior MCA territories. In this system a score of 10 is considered normal. A score of 7 or less indicates the presence of extensive early ischemic change and thus the potential for increased risk for hemorrhagic transformation.24
Other findings on NCT may provide useful insight into a patient’s medical history. This is especially important in the acute setting since obtaining a patient’s past medical history is often difficult. From the non-contrast scans, evaluation for vascular calcifications, lacunar infarcts, and periventricular white-matter hypo-attenuation can be highly suggestive of underlying vascular risk factors such as diabetes, hypertension, hyperlipidemia, chronic renal disease, and/or significant smoking history.25–30 Also, the presence of prior cortical infarcts, especially in different vascular territories, will significantly increase the probability of an embolic stroke etiology.
Computed Tomography Angiography
With current 64-channel multidetector CT (MDCT) technology, rapid high-resolution imaging of the vasculature from the aortic arch to the skull vertex can be performed in about four to six seconds with diagnostic quality near that of conventional digital subtraction angiography (DSA).31,32 Compared with DSA, CTA demonstrates a sensitivity and specificity of 98.4 and 98.1%, respectively, for vascular patency of the intracranial arteries from the internal carotid artery to the proximal vessels of the circle of Willis and the sylvian MCA vessels.33 The intracranial vessel status depicted by CTA has been shown to have prognostic value in response to IV tissue plasminogen activator (tPA). The presence of proximal MCA occlusion compared with distal MCA occlusion or no occlusion to the M3 level on CTA has been shown to be a predictor of worse clinical outcome in patients receiving IV tPA.34 Other studies using CTA have shown that there is little benefit from IV recombinant tPA (rtPA) in patients who demonstrated poor collateral flow by CTA, spontaneous recanalization, or proximal ‘top of internal carotid artery (ICA)’ saddle emboli.34,35 Due to the poor response to IV tPA in patients with proximal intracranial vessel occlusions, some researchers are investigating early intra-arterial (IA) tPA in the less-than-three-hour time window based on CTA.36
The neck CTA component also provides important additional information for the management of an acute stroke patient. Carotid atherosclerosis accounts for approximately 30% of all ischemic strokes.37 Carotid stenosis detected by CTA is comparable to that measured by DSA, with a sensitivity of 100% and specificity of 95% when the axial source images (SIs) are used.38 In addition, CTA provides direct characterization of the atherosclerotic plaque, depicting ulceration, the soft and calcified components, and the thickness of the fibrous cap.39 Near-occlusive carotid stenosis, a potential pitfall for carotid Doppler ultrasound, can also be detected by CTA.40 CTA of the neck is also capable of depicting cervicocephalic dissections, a common cause of acute stroke in young patients.41,42
CTA images should be analyzed in a systematic process given the large size of the data set. In the setting of acute stroke, detection of vessel occlusion is of paramount importance. This is most rapidly accomplished by reviewing the coronal maximum-intensity projection (MIP) re-formatted views that are readily available at the console on most scanners. Large vessel occlusions involving the ICA, intra-dural vertebral arteries, basilar artery, M1, A1, and P1 are readily identified on coronal MIP views. If an abnormality explaining the patient’s symptoms is not readily apparent, careful review of the axial SIs, with the use of both 3D and thick MIP re-formatted views, on a dedicated 3D workstation is recommended. A common pitfall in the interpretation of CTA is missing an occlusion because retrograde opacification of the vessels distal to the occlusion via collaterals makes the detection of a focal occlusion challenging (see Figure 2). After identification of the vascular lesion it is important to note the status of the collateral circulation from Willisian and leptomeningeal collaterals.
In addition to evaluating the vasculature, source CTA images provide valuable information about perfusion through the brain parenchyma. This is an underutilized feature of CTA, since most multimodal CT protocols incorporate CTP imaging for a detailed evaluation of the brain parenchymal perfusion. However, CTA SIs may be helpful if the area of concern is not covered in the CTP images, especially with regard to the posterior fossa. CTA SIs have been shown to be superior to NCT for detecting acute ischemic changes of the posterior circulation.43,44 Also, the CTA SIs are helpful when the CTP images are limited by patient motion or inappropriate contrast bolus. When interpreting parenchymal changes on CTA SIs, attention has to be paid to the scanner on which they are acquired. With the earlier-generation 16-channel or fewer MDCTs, they have been shown to be more representative of cerebral blood volume and have correlated well with diffusion-weighted imaging (DWI) abnormalities seen on magnetic resonance imaging (MRI).45,46 However, with current 64-channel MDCT, due to the rapid image acquisition, lesions seen on CTA SIs more closely approximate cerebral blood flow (CBF) lesion volumes seen on CTP. Regardless of the scanner, CTA SIs are superior to CT in the detection of early ischemic changes, as shown in Figure 3.
Computed Tomography Perfusion
CTP is the most complex component of multimodal CT for acute stroke. It has been shown to increase sensitivity for diagnosing acute ischemia compared with CT and CTA alone.47 In addition, CTP has the possibility of differentiating the infarct core from the ischemic penumbra. A recent study suggests CTP can be used to predict benefit after thrombolysis.48
The three main CTP parameters used to evaluate acute stroke patients are cerebral blood volume (CBV), CBF, and mean transit time (MTT). These parameters are related to each other by the central volume principle, which states that CBV = CBF x MTT.49 CBV represents the volume of blood per unit brain mass (ml per 100g of brain tissue). MTT represents the time difference from arterial inflow to venous outflow (seconds). CBF represents the volume of blood per minute moving through a unit of brain mass (ml/minute per 100g of brain tissue). These parameters are calculated from the source data most commonly by using a mathematical process known as delay-insensitive or delay-compensated deconvolution.5,50 However, other non-deconvolution-based methods exist and a formal comparison of the various methods has not yet been performed.5,50 The exact method to derive these parameters varies between vendors. In the deconvolution method, a point is chosen for the arterial input function and another point for the venous outflow function. Typically the A2 segment is selected for the arterial input function and the posterior superior sagittal sinus is selected for venous outflow, although this is also a debated issue.49,51 A normal CTP scan is shown in Figure 4.
There is considerable debate as to which CTP parameters best depict infarcted tissue from surrounding ischemic penumbra.5 In one theoretical model, there is a proposed failure of autoregulation of cerebral perfusion in infarcted tissue. As a result, in infarcted regions the CBV is decreased because of failure of vasodilatation and lack of increased collateral flow. Correspondingly, CBF is decreased and MTT is increased, while in ischemic penumbral tissue autoregulation is still intact, which results in vasodilatation and recruitment of collaterals to compensate for the decreased CBF. As a result, the CBV is normal or increased while the CBF is decreased and correspondingly the MTT is increased. As a practical matter, since gray and white matter CBF values at baseline differ significantly (70ml/minute/100g in gray matter compared with 20ml/minute/100g in white matter) but MTT values between gray and white matter are not as variable (five seconds for gray matter and six seconds for white matter), MTT images are more sensitive to detect ischemic changes from baseline perfusion.52–54
An alternative hypothesis that results in similar changes in CBV, CBF, and MTT in the infarct core and penumbra implies the changes are primarily secondary to venous collapse in the infarcted tissue versus venous dilation in the penumbral tissue.3 Wintermark et al. confirmed these predicted changes in CTP parameters in one of the largest trials, evaluating data from 130 patients using receiver operating characteristic (ROC) curve analysis. They found that areas defined by an absolute CBV less than 2.0ml/100g best depicted the infarct core while regions defined by a relative MTT increase of 145% compared with the contralateral normal side best depicted the ischemic penumbra. Since there are known differences between vendors in the processing of CTP data, the use of absolute thresholds is of limited value for generalization purposes. As such, current expert opinion favors the use of relative CTP values.50 In this regard, the evaluation of infarct core proposed by Wintermark et al. may be best approximated by CBV values decreased by 65% relative to the normal contralateral side.52 Other proposed methods to depict infarct core from penumbra include absolute and relative CBF thresholds and CBF x CBV thresholds.55–58
At our institution, in the management of acute stroke patients we find colorimetric CTP parameter maps adequate for clinical decision-making. The perfusion images are always interpreted in the context of the clinical presentation and the vascular lesion based on the CTA.
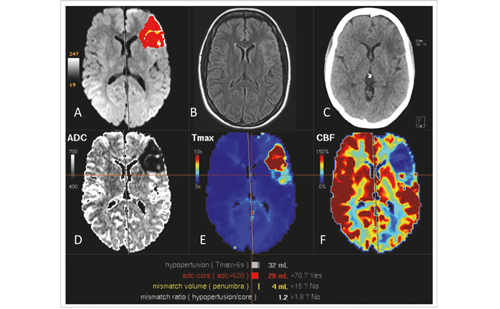
Mismatch is determined by comparing the decreased CBV lesion with the prolonged MTT lesion by visual inspection. A typical case is shown in Figures 5A and 5B. In select cases where the ischemic lesion is small, selective regions of interest (ROI) are drawn to perform a more quantitative analysis for confirmation, as shown in Figures 5C and 5D. In the future, the analyses may become more automated, allowing for standardized post-processing and interpretation.59
One of the main limitations of CTP currently is its limited coverage. Most CTP protocols are centered at the basal ganglia and focus on coverage of the MCA territories. This is particularly problematic if the patient has posterior circulation ischemia, which may be missed because it was not imaged. Preliminary work with 256-channel MDCT demonstrates the feasibility of whole-brain CTP with associated radiation dose reduction as well.60 Another limitation of CTP is its limited ability to detect small infarcts. This can be problematic as small infarcts in eloquent locations can result in significant neurologic deficits. Additionally, detection of acute ischemia superimposed on chronic infarct or severe periventricular white matter ischemic changes can be difficult.51 Lastly, CTP interpretation can be limited when there are bilateral vascular lesions, making comparison with the contralateral side difficult. In this situation the use of absolute thresholds may be useful.
Conclusion
Multimodal CT for the evaluation of acute stroke is becoming increasingly important as there continues to be a growing need to rapidly diagnose acute stroke patients. It is an ideal tool for imaging acute stroke patients in the community given its widespread availability and its rapid image acquisition. Multimodal CT demonstrates good sensitivity and specificity in diagnosing acute stroke.
There is also hope that the CTP component of multimodal CT will be able to discriminate among acute stroke patients by determining those who will likely benefit from intervention from those who would not regardless of their time of presentation. Considerable work still needs to be undertaken in this regard to standardize the processing and interpretation of CTP images. ■