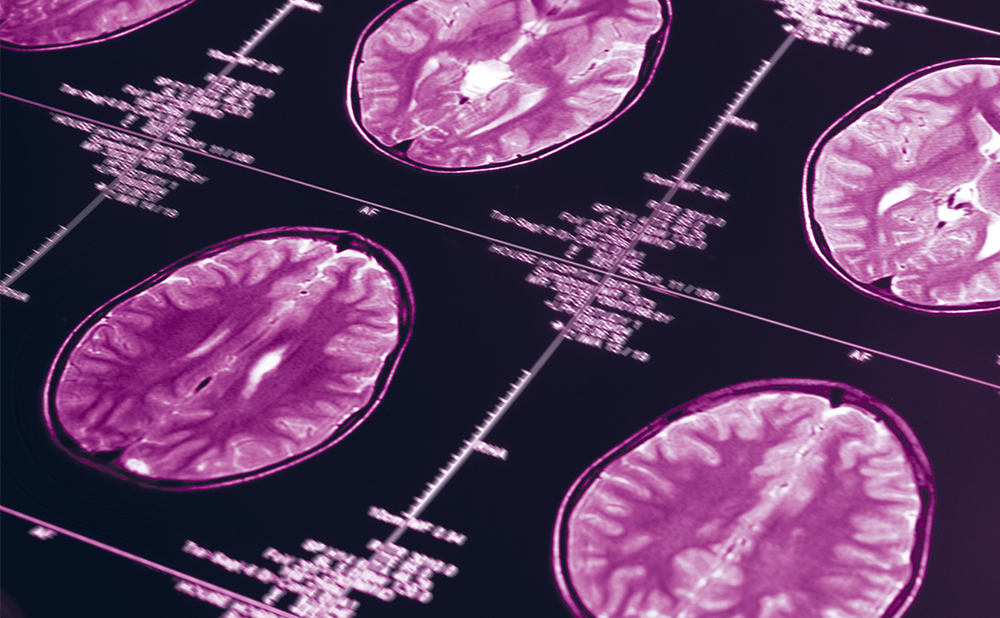
Functional magnetic resonance imaging (fMRI) is a fairly new tool that has been used to measure brain activation utilising the dependency of the magnetic properties of haemoglobin on the amount of oxygen it carries. Blood-oxygen-level-dependent (BOLD) signals measure the alterations in cerebral blood flow that mark functional brain activity.1 The intrinsic BOLD contrast makes fMRI an invaluable non-invasive instrument for the investigation of the underlying physiological disturbances that lead to manifest psychiatric disorders. The brain is imaged at discrete time intervals while a subject is required to carry out a task or presented with a stimulus.
The success of the operation depends on three aspects: the scanning sequence used, the design of the stimulus paradigm and the methods used for data analysis.2 Possible failures during any of these three steps can cause unfavourable evaluation of the measured functional activity and affect the reliability of the conclusions drawn. The fact that these three steps are often carried out by different scientists requires strong collaboration among groups.
It is hoped that successful application and analysis of fMRI in neurological disorders can be used to characterise and diagnose mental illnesses such as Alzheimer’s disease, schizophrenia, bipolar disorder, mild traumatic brain injury and addiction. Both healthy controls and patients can be scanned during various tasks, and responses to these stimuli can be measured and compared to discover the differences between the two groups and investigate how the brain function of patients differs from that of healthy controls.
Among these mental illnesses, schizophrenia is a neurodevelopmental disorder that might result from several factors such as genetic inheritance, disturbance of the in utero environment and exposure to biological and psychosocial factors in infancy and early childhood.3 It is extremely important to be able to determine people with a high risk of schizophrenia to prevent the onset of schizophrenia in persons with prodromal symptoms and to reduce the severity of the illness in those who already have schizophrenia via early diagnosis and intervention.3
There is no gold standard in the diagnosis of schizophrenia and there are complications in the objective evaluation of the examinations. Interviews and symptom history are the main factors that determine the diagnosis, but conclusions may change because different combinations of symptoms may be observed in various patients, and these symptoms may change over time for a particular patient.4 This makes schizophrenia a complex disorder to diagnose even for an expert. Biological markers – defined as objective, measurable phenomena that may identify subjects at increased risk of development of disease – should be sought in order to intervene as soon as possible so as to improve prognosis.3 Objective clinical diagnosis methods are better obtained using biologically measured quantities such as fMRI. Therefore, fMRI has been used in schizophrenia research studies to evaluate prognostic and diagnostic methods. We would like to provide an overview of schizophrenia research using fMRI data and give specific examples based mostly on our past and recent work.
fMRI data is available in the form of 3D high-resolution images that change over time (tens of thousands of voxels). Extraction of useful information, patterns of abnormalities, available in the 4D data sets during the comparison of healthy controls and patients, presents numerous challenges for researchers. The problem can be represented in a space where each of the subjects is represented with the number of voxels times number of time-points and it is extremely difficult to solve since the dimensionality of the space is orders of magnitude larger than the number of available subjects. This high-dimensional space is mostly empty, and the discriminative information between patients and healthy controls is accumulated in the corners of the high-dimensional space.5,6 It is easier to access this information in a lower-dimensional subspace after efficient projections during which separability information is kept and redundant information is removed. These projections should be carefully determined for the results to be effective and generalisable to larger fMRI data sets.
Schizophrenia is a complex neurological disorder that is thought to involve a disturbance of coupling or disconnection between large-scale cortical systems, and is unlikely to be limited to dysfunction of a circumscribed brain region.7 As an example of such disconnections of functional connectivity, we have examined fMRI data of healthy controls and patients after an independent component analysis (ICA) for two different tasks. Time courses corresponding to different independent components were investigated in the frequency domain using the Granger causality test (GCT), and causal relationships between brain activation networks were compared for healthy controls and schizophrenia patients.8 The algorithm that employs both ICA and GCT depicted complex causal interactions among distributed, functionally integrated networks and showed distinct differentiations between healthy controls and schizophrenia patients.
As in the example above, most similar fMRI studies apply simple group averaging for patients and controls to differentiate between classes. Nevertheless, group differences do not necessarily hold for each individual subject, and research studies concentrating on prognostic/diagnostic classification should be more specific for better predictions. This requires even more careful manipulation of the data to prevent certain biases and not to be too specific to the data set used.
There have been numerous research efforts claiming to differentiate patients with psychological impairments with promising classification accuracies. We believe that there is much to be done to develop effective diagnostic tools and there are important issues to take into consideration in analysing fMRI data and presentation of the classification performances so that fMRI can be employed more appropriately in diagnostic efforts in clinical settings. In this article, we would like to emphasise common possible biases and offer some solutions with the hope that fMRI can be more efficiently used in diagnostic research.
Biases in Classification
fMRI has long been used in classification, sometimes in conjunction with structural MRI, volumetric MRI and magnetoencephalography (MEG) data, but the findings cannot yet be used reliably for diagnostic purposes despite the promising prediction performances presented in the literature. Unreliability of the results could result from either the data set involved or the techniques applied during data analysis. In this article, we would like to mention previously published classification studies that use fMRI data and identify possible biases to draw attention to them. We hope that these will help fMRI data be used more efficiently for more generalisable and reproducible classification results in schizophrenia research in the near future. We list biases and give examples below.
Limited Number of Available Subjects
Classification studies employ various algorithms to extract the most important discriminating features available in a training set and use the same features to assign class memberships for subjects in a test group. Obtained prediction accuracies depend on how well the extracted features from a training set represent the subjects in the test group. It is crucial to have a large group of subjects in the training set so that extracted features will be generalisable to test subjects too. The extracted features using only a small training set will likely not represent all of the subjects in the whole population and just highlight the characteristics of the small set. This might cause overfitting, and prediction performances are usually valid for just that specific test group.
Increasing the number of subjects in the training set, possibly using data from multiple sites, will include the site variations and help validation of the results. The Mind Clinical Imaging Consortium4,9 and the Function Biomedical Informatics Research Network10 are among the efforts that attempt to combine fMRI data from multiple sites.
Shinkareva et al.11 identified the groups of voxels showing temporal dissimilarity using an RV coefficient12 (a measure of temporal dissimilarity) and worked directly with fMRI time series data from brain regions of interest. They presented a prediction accuracy of 85.71% using a leave-one- out cross-validation on 14 subjects (seven schizophrenia patients and seven healthy controls) using functional activity in brain frontal areas during a Stroop task, which involved presentation of task-relevant (colour) and task-irrelevant (emotional meaning) attributes of different words. The results seemed promising. This set of 14 subjects was selected among a group of 32 available subjects (16 schizophrenia patients and 16 healthy controls). Providing more information on the selection procedure and why only seven participants, but not more, from each subclass were used would be useful in interpreting the results. We were motivated by the effectiveness of the temporal data used and the method employed. When we carried out a similar analysis on a set of more than 100 subjects, we were not as successful.
Separately, we applied a projection pursuit technique to decrease the dimensionality of fMRI data obtained during an auditory oddball task on 70 subjects (34 schizophrenia patients, 36 healthy controls) from the New Mexico site of the Mind Research Network.9 The technique included various data reduction stages including an application of an ICA and selection of different brain activation networks. Promising overall prediction accuracies varying between 80 and 90% were obtained. We propose that including data from different sites would help validation of these results because each site brings variables such as operators, scanning equipment and parameters, as well as population distribution.
Presenting Only the Overall Prediction Accuracy
After selecting the important features in a training data set and measuring the performance of the technique on a selected test group, it is important to report the classification performance of each class separately, especially when the classes include considerably unequal numbers of subjects. This requires presentation of specificity and sensitivity in a two-class prediction model. Reporting only the overall prediction accuracy will not explain the overall performance of the technique.
Ford et al.13 combined structural and functional MRI data for classification purposes. They extracted hippocampal formation by applying a mask and then extracted the functional and structural data within the mask. The high-dimensional data were then projected onto a lower-dimensional space, and Fisher’s linear discriminant (FLD) analysis was used to maximise the ratio of between-class and within-class variability considering the training set. The prediction accuracy of the classifier was tested using a total of 23 subjects (15 schizophrenia patients and eight healthy controls) with a leave-one-out method. One of the subjects was removed from the whole set for validation purposes (K=1, one-fold cross-validation), and the rest of the subjects were used as training data. A maximum classification accuracy of 83–87% was presented, which is reasonable. However, it would also be informative to know the prediction performances of both classes separately, especially in this case where the number of subjects in the two groups differs. For example, for this particular set, 85% overall prediction performance could possibly be obtained with 100% detection performance on schizophrenia patients and only a 57% detection performance on healthy controls (43% false alarm), which would indicate a poor performance on healthy controls.
In a similar study, Ford et al. also proposed to use principal component analysis (PCA) to represent subjects in a lower-dimensional space with maximal variance and uncorrelated samples, based on the idea that fMRI activation patterns show differentiations among healthy controls, patients with schizophrenia, Alzheimer’s disease and mild traumatic brain injury. The FLD classifier was applied to fMRI brain activation maps in this lower-dimensional space to differentiate patients from healthy controls.14 The prediction accuracy of the schizophrenia patients varied between 60 and 80% for different numbers of principal components on a set of 25 subjects (10 healthy controls and 15 patients with schizophrenia). Specificity and sensitivity performances were not reported separately. The authors appropriately pointed out that their results should be interpreted cautiously because of the small data set.
Selection Bias (Overfitting)
Application of cross-validation tools appropriately during class prediction and diagnosis studies is crucial and even more important than the choice of algorithmic methods. K-fold cross-validation techniques should be applied in all steps of designing a classifier, including feature selection. For generalisable conclusions and results, cross-validation should be applied at every stage of the classification algorithms, not only during performance evaluation. Reproducibility of the obtained classification accuracies also requires careful selection of data, and the selection process should be explained in detail in studies.
Job et al.15 extracted three brain areas in a comparison between eight schizophrenia subjects and 57 control subjects. The same subjects used in region selection were also used in classification. Such an approach tends to bias the results as the information on the classes has been used to select the brain areas. Areas showing possible differentiations between schizophrenia and control subjects can be selected with minimal to no bias by determining the regions without using the test subject in each iteration and then performing classification of the left-out subject only.
Georgopoulos et al.16 presented a classification method using MEG and assigned group memberships to subjects with various illnesses (Alzheimers disease, schizophrenia, multiple sclerosis, Sjogren’s syndrome, chronic alcoholism, facial pain). They used 248 axial gradiometers on 142 human subjects and obtained 30,628 partial zero-lag cross-correlations between sensors for all sensor pairs and used them as the predictor set. They looked for subsets of this predictor set and investigated whether any such predictor subsets correctly classified subjects into their respective groups. This was a dimensionality reduction problem. They indicated that a subset of 12 predictors (correlations) gave a prediction accuracy of 86.6% and assigned 86.6% of the subjects to their respective groups correctly. They used this same set of 12 predictors and presented cross-validation results around 77–79% with two different jackknifed methods: k-fold and leave-one-out. Although these results are encouraging, especially given the specificity of the approach to multiple different groups, they appear to be biased to the data at hand because the same set of 12 predictors was used for each different training set, and a different set of predictors was not obtained for each training set separately.
Fan et al.17 applied a multivariate classification approach combining data from both a functional feature map (cerebral blood flow) and structural MRI data to detect brain abnormality associated with pre-natal cocaine exposure in adolescents. Regions with voxels of similar correlation to the disease were obtained using a Pearson correlation coefficient for three different feature maps separately. A leave-one-out method was employed and an effective cross-validation strategy was followed to measure the overall correlation of a feature to class label. Then, statistical regional features (histograms) and a PCA were used to represent each region with a feature vector. Subjects were represented with the vectors from three different feature maps. Promising results were obtained on 49 subjects (25 pre-natal cocaine-exposed subjects and 24 normal controls). Fan et al.17 mention the possibility that obtained classification accuracy might be an indication of overfitting based on the random permutation tests they performed.
Parameter Selection (Optimisation Bias)
Selecting a set of parameters based on the prediction accuracy obtained and using the set of parameters with the best performance in the final classifier is an example of parameter selection or optimisation bias. Even if cross-validation is applied in every step of the algorithm, we might cause optimisation bias if we run our experiment multiple times with the same data and select the parameters accordingly to get the best prediction performance. The set of parameters obtained using the best classification performance might not necessarily give the best performance for a different set and might not be the best projection that could be applied for the best diagnosis method.
Data Fusion of Functional Magnetic Resonance Imaging with Other Data Sets
Various types of data, such as structural imaging,15,17 functional imaging, neuropsychological score and genetics, have been used either individually or combined to develop biomarkers for prognostic or diagnostic purposes. The use of combinations of multiple measures to improve diagnostic results and obtain more dependable conclusions is attracting increasing interest.
Environmental factors play an important role in the development of schizophrenia, but studies have also consistently shown that relatives of schizophrenia patients have a higher risk of having the impairment compared with relatives of controls. New insight has been provided into processes underlying this premise by the recent identification of several putative schizophrenia susceptibility genes. Particular genes received increasing attention in chromosomal studies and some protein products may be involved in regulation of neurotransmission related to schizophrenia.3 How these genes might relate to abnormal functional activation patterns in schizophrenia, and which genes are expressed in the brain, carries great importance and is currently being investigated.
Identification of risk genes for schizophrenia and other mental disorders currently motivates psychiatric research and helps the emergence of more comprehensive and testable models for psychiatric illnesses. Integration of genetics with brain imaging might have the potential to help us better understand how human brain functions in schizophrenia through the identification of functional imaging tools and genetics. However, combining imaging data with genetics is sophisticated and requires efficient methods, since both data types include huge amounts of information.7
In addition, a lack of clear diagnostic boundaries is particularly evident with respect to schizophrenia and there is extensive overlap with neurophysiology, imaging, cognition, candidate genes and treatment response.7 It is our hope that efficient methods and clear definitions will ultimately translate into improved diagnosis and classification of psychiatric illnesses, with an impact on clinical practice.
Conclusion
Recent novel ideas and findings from clinical and molecular genetics, cellular biology, brain structural and functional studies, engineering, statistics and clinical phenomenology have refreshed psychiatric research and necessitated strong collaboration and continuous input from scientists belonging to diverse fields.
fMRI is among these fields and it has been a very useful tool in the investigation of mental illnesses such as schizophrenia, but it still has not reached the point where it is systematically and effectively used in the diagnosis of schizophrenia. More effective stimulus paradigms and classification algorithms specific to schizophrenia should be designed and implemented so that this valuable measurement tool can be utilised more expeditiously in clinical settings. This target requires strong collaboration among researchers from various fields beyond that of psychiatry.
Image analysis techniques that have been used with fMRI data require crucial attention to detail in order not to give rise to any biased results. Cross-validation tools should be used more effectively and applied at every stage of the classification analysis, including feature selection to obtain more generalisable results.
Most fMRI studies investigating schizophrenia suffer from the limited availability of subjects. Generalisation of the results and discussions should be provided with tests on larger data sets. Possible inconsistencies of the findings that may be encountered with the repetition of experiments should be investigated. Whether the results are static (trait-like) abnormalities or dynamic (state-like) phenomena should be clarified and the repeatability of fMRI tests should be examined.18 Combining data, possibly from multiple sites with collaboration between scientists, and including them in the analysis for larger training sets is necessary for reproducibility of the obtained classification accuracies.
Both genetics and environment play important roles in brain development and function. Image analysis techniques help identification of image-based biological markers and work towards understanding schizophrenia, but integration of genetics with brain imaging should facilitate the understanding of the disease further. ■