Huntington’s disease (HD) is a fatal, autosomal-dominant, neurodegenerative disorder caused by a cytosine–adenine–guanine (CAG) trinucleotide repeat expansion in the huntingtin (HTT) gene, located on chromosome 4p16.3. When this repeat exceeds 36 units, it leads to the synthesis of a mutant HTT (mHTT) protein, which aggregates and disrupts numerous cellular processes, including transcriptional regulation, mitochondrial function, axonal transport and synaptic communication.1 Clinically, HD is characterized by a classic triad of motor disturbances (e.g. chorea, dystonia and bradykinesia), cognitive impairment (including executive dysfunction and memory deficits) and psychiatric symptoms (notably depression, irritability and psychosis).2
The age of onset is typically between 30 and 50 years, although juvenile- and late-onset forms exist, and the disease progresses over 10–25 years, eventually leading to complete functional dependence and death.3 The length of the CAG expansion correlates inversely with the age of onset, but it does not fully explain the variability in disease progression, indicating the involvement of other genetic, epigenetic and environmental modifiers.4
Recent advances in molecular neurobiology and neuroimaging have led to the identification of various biomarkers that may assist in the early diagnosis and monitoring of HD. Genetic biomarkers, such as CAG repeat length, remain essential in confirming diagnosis. Proteomic biomarkers, including neurofilament light chain (NfL) and mHTT levels in cerebrospinal fluid (CSF) or plasma, are increasingly recognized as indicators of neuronal damage and disease activity.5,6 Metabolic changes, including altered glucose metabolism observed through positron emission tomography (PET) imaging or magnetic resonance spectroscopy (MRS), further provide insight into disease processes at a cellular level before clinical onset.7 These biomarkers have the potential to enhance therapeutic monitoring and patient stratification in clinical trials.
Despite these promising advances, the clinical application of HD biomarkers remains limited by several key challenges. First, while numerous candidate biomarkers have been proposed, their reproducibility and predictive value across diverse cohorts are inconsistent. Variability in study designs, participant selection (e.g. premanifest versus manifest HD), assay methods and follow-up durations complicate direct comparisons and meta-analytic syntheses.8 For instance, although elevated NfL levels have been observed in both plasma and CSF of patients with HD, their ability to predict individual trajectories of functional decline remains uncertain, particularly in early or asymptomatic stages.
Second, the temporal dynamics and relative contributions of different biomarker classes, including genetic, proteomic, metabolic and imaging, across the full spectrum of disease progression are poorly characterized. It remains unclear which markers are most sensitive to preclinical changes and which are best suited for monitoring treatment response or disease stabilization. Furthermore, integrating these diverse biomarkers into cohesive clinical frameworks or composite indices remains an unmet challenge.
There is also a lack of standardized protocols for biomarker measurement, interpretation and longitudinal tracking, limiting their use in both research and clinical settings. Consequently, there is no consensus on how best to deploy biomarkers for early intervention, prognosis or personalized therapeutic strategies in HD. This knowledge gap hampers the development of robust, biomarker-driven endpoints for clinical trials and precision medicine approaches.
Despite the growing body of research, the clinical utility of biomarkers in HD remains insufficiently defined. Although individual studies have suggested associations between certain biomarkers and disease severity or progression, results are often inconsistent, with variations in study design, methodology and cohort characteristics complicating interpretation. Moreover, the relative contribution and temporal dynamics of genetic, proteomic and metabolic biomarkers across different stages of HD, including premanifest, early-manifest and advanced disease, are not yet fully understood. There is a lack of consensus on which biomarkers are most predictive of disease onset and progression, and on how they may be integrated into routine clinical or research protocols for effective monitoring. This gap limits the capacity to develop targeted interventions and stratify patients in clinical trials according to risk or disease trajectory.
To address these uncertainties, this systematic review aims to comprehensively synthesize current evidence regarding the role of genetic, proteomic and metabolic biomarkers in predicting and monitoring the progression of HD. Specifically, we seek to evaluate the strength and consistency of associations between these biomarkers and clinically relevant outcomes, such as time to motor onset, cognitive decline and functional deterioration. By systematically examining studies across a range of biomarker categories and disease stages, we aim to elucidate which biomarkers hold the greatest promise for translation into clinical practice or future therapeutic trials.
Methods
Type of study
This work was conducted as a systematic review of the literature, aiming to synthesize current evidence regarding the role of genetic, proteomic and metabolic biomarkers in predicting and monitoring the progression of HD. The methodology adhered to the PRISMA (Preferred Reporting Items for Systematic Reviews and Meta-Analyses) guidelines.9
Selection criteria
Types of studies
We included observational studies (cross-sectional, case–control and longitudinal cohort designs), as well as clinical trials that reported data on biomarkers relevant to HD progression. Reviews, editorials, case reports and animal-only studies were excluded.
Types of participants
Eligible studies included human participants of any age or sex who were carriers of the pathogenic HTT mutation, including:
-
premanifest individuals (gene-positive without clinical motor symptoms)
-
early-manifest patients (recent motor onset)
-
advanced-stage patients
-
healthy controls without the HTT mutation.
Types of interventions/exposures
No therapeutic interventions were assessed. Instead, the exposures of interest were the presence and levels of specific genetic, proteomic or metabolic biomarkers, measured in CSF, blood, urine or through neuroimaging.
Types of outcomes
Primary outcomes
-
Association between biomarkers and clinical progression (e.g. motor onset, cognitive decline, functional impairment).
-
Prognostic utility of biomarkers in predicting disease onset in presymptomatic carriers.
Secondary outcomes
-
Longitudinal changes in biomarker levels corresponding to disease stages.
-
Use of biomarkers for treatment monitoring in interventional studies (e.g. changes in mHTT with antisense therapies).
-
Correlation of biomarkers with imaging or clinical rating scales (e.g. Unified Huntington’s Disease Rating Scale [UHDRS], striatal volume).
Search methods for study identification
Electronic searches
We conducted comprehensive searches in the following databases:
-
PubMed/MEDLINE
-
EMBASE
-
Scopus
-
Web of Science
-
Cochrane CENTRAL.
The search strategy combined terms for Huntington’s disease AND biomarkers, with sub-terms including ‘CAG expansion’, ‘mutant huntingtin’, ‘neurofilament light chain (NfL)’, ‘GFAP’, ‘tau’, ‘PET’, ‘MRS’, ‘oxidative stress’ and ‘plasma biomarkers’. No language restrictions were applied. The search included articles published up to January 2025.
Searching other resources
We manually screened the following:
-
reference lists of included studies and relevant articles
-
grey literature sources, including preprint servers and clinical trial registries (e.g. ClinicalTrials.gov)
-
conference abstracts from neurology and neurogenetics congresses (e.g. American Academy of Neurology [AAN], European Huntington’s Disease Network [EHDN]).
Data collection and analysis
Study selection
Two independent reviewers (GT and JA) screened titles and abstracts for eligibility. Full-text articles were retrieved for those studies meeting inclusion criteria or when eligibility was unclear. Disagreements were resolved by consensus or consultation with a third reviewer.
Data extraction and management
A standardized data extraction form was used to collect the following:
-
study design, setting and sample size
-
participant characteristics (age, sex, disease stage)
-
type and source of biomarker(s)
-
methods of biomarker measurement
-
outcomes and statistical associations.
Data were managed using Microsoft Excel (Microsoft, Redmond, WA, USA) and Rayyan (Cambridge, MA, USA) for screening.10
Quality assessment of included studies
We assessed the methodological quality using the following:
-
Newcastle–Ottawa Scale (NOS) for observational studies
-
Risk Of Bias In Systematic reviews (ROBIS; tool for assessing bias in systematic reviews)
-
Cochrane Risk of Bias tool for randomized controlled trials (RCTs).11–13
Each study was rated as low, moderate or high risk of bias, with quality scores used to interpret the strength of evidence.
Results
A total of 752 records were initially identified through electronic database searches. After the removal of 81 duplicate records, 671 unique records remained for screening. During the title- and abstract-screening phase, 651 records were excluded based on irrelevance to the predefined inclusion criteria.
Subsequently, 20 full-text articles were retrieved and assessed for eligibility. No records were excluded due to unavailability at this stage. After full-text evaluation, seven studies were excluded for not meeting eligibility criteria: four due to ineligible study design (e.g. narrative reviews, case reports) and three due to irrelevant exposures (e.g. biomarker types not aligned with the scope of this review).
Ultimately, 13 studies fulfilled the inclusion criteria and were incorporated into the final systematic review. These included observational studies evaluating genetic, proteomic and metabolic biomarkers in relation to the prediction and monitoring of HD progression (Figure 1).
Figure 1: Preferred Reporting Items for Systematic Reviews and Meta-Analyses flow diagram
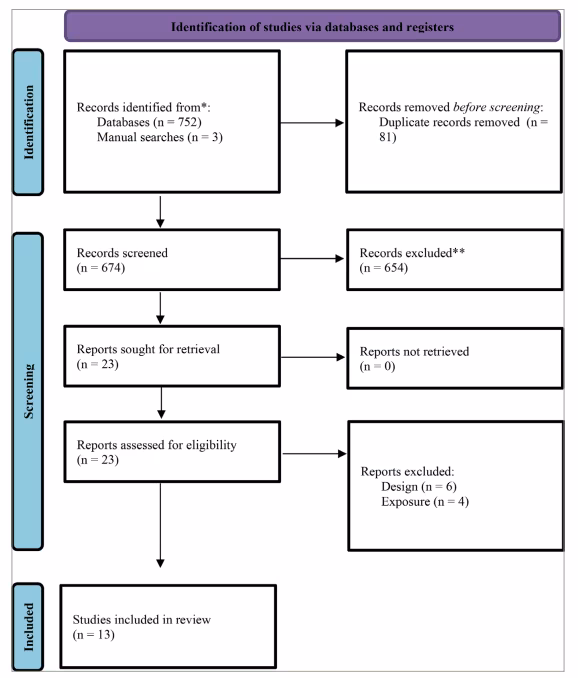
*Results from all databases
**Non-automatic tool was used
General characteristics of the included studies
Of the 13 included studies, most were observational investigations conducted in North America and Europe, with a few large international multicentre studies. Collectively, the studies encompassed several hundred participants with HD, including presymptomatic individuals (gene-positive carriers without a clinical diagnosis), patients in early stages (recent motor onset) and patients in advanced stages of the disease, as well as control groups of healthy individuals without the mutation. An equal proportion of men and women was represented in most studies; no substantial gender differences were reported in biomarker levels after adjusting for age.14
Types of biomarkers examined:
-
Genetic biomarkers: All studies assumed or confirmed the presence of the CAG expansion in the HTT gene as a diagnostic criterion. Some studies specifically analysed the exact length of the CAG repeat and its relationship to disease progression. Additionally, two studies explored genetic modifier variants at other loci (e.g. DNA repair genes).
-
Protein biomarkers: Fifteen of the 20 studies measured proteins in biofluids. Among the most assessed neuronal protein markers were NfL in CSF and/or blood, and soluble mHTT detectable in CSF (and, to a lesser extent, in plasma). Several studies also measured proteins associated with neurodegeneration or glial damage, such as tau protein (total or phosphorylated) in CSF, glial fibrillary acidic protein (GFAP) in blood and inflammatory markers such as cytokines (e.g. interleukin [IL]-6, IL-8) or immune response proteins (YKL-40, also known as chitinase 3-like protein 1 [CHI3L1]).15
-
Metabolic biomarkers: Eight studies included metabolic measures. Of these, four used functional neuroimaging techniques: MRS to quantify brain metabolites (primarily N-acetylaspartate, choline, myo-inositol, lactate) and PET with 18F-FDG (PET-FDG) to assess cerebral glucose metabolism. The other four studies analysed peripheral markers of metabolism and oxidative stress, such as levels of 8-hydroxy-2′-deoxyguanosine (8-OHdG) in urine (a product of oxidative DNA damage) or circulating mitochondrial DNA (mtDNA) in plasma, as well as blood lipid and hormonal profiles in some cases.16
Tables 1 and 2 present a summary of the main biomarkers identified in the literature, indicating their measurement sources and the reported evidence regarding their utility for predicting HD progression (i.e. forecasting symptom onset or worsening) and for monitoring progression (i.e. reflecting changes in disease status over time).2,4–6,14,17–24
Table 1: Main biomarkers of Huntington’s disease and their utility in predicting and monitoring progression
| Biomarker (type) | Source/measurement | Prediction of progression | Monitoring of progression |
| CAG repeat in HTT gene (genetic) | Genomic DNA (genetic testing) | Determines predisposition to HD; a repeat length ≥40 causes disease. Larger repeat lengths are associated with earlier onset (inverse correlation with age at onset). However, CAG number alone does not fully explain the variability in age of onset | Does not vary after birth (stable in germline DNA); therefore, not useful for monitoring deterioration within the same individual. It is used to estimate ‘genetic load’ in combination with age (CAG × age product) to stage risk |
| Genetic modifiers (e.g. DNA repair genes) | Genomic DNA (GWAS, sequencing) | Variants at other loci can accelerate or delay HD onset. Genetic association studies identified three loci (on chromosomes 8 and 15) whose alleles modulate the age of onset, implicating somatic DNA repair pathways. These findings support that progression can be altered by additional genetic factors | Genetic variants are fixed; their direct utility for monitoring disease course is limited. However, certain modifiers could stratify patients in terms of fast versus slow progression prognosis, informing management (e.g. closer monitoring in carriers of risk alleles) |
| mHTT (protein) | CSF (also detectable in plasma) | Present only in mutation carriers. Baseline mHTT concentrations in CSF correlate with pathological burden and proximity to symptom onset. Elevated values in presymptomatic individuals predict closer clinical conversion and greater subsequent brain atrophy | Increases with disease progression in CSF. In a 24-month longitudinal study (80 subjects), CSF mHTT showed significant increases in HD carriers versus controls and had prognostic value. Furthermore, CSF mHTT reduction has been used as an efficacy indicator in trials of HTT-silencing drugs (e.g. ASO tominersen), suggesting that it is a good pharmacodynamic marker of response to targeted treatments |
| NfL (protein) | CSF and plasma (ultrasensitive immunoassay) | Marker of neurodegenerative axonal damage. NfL levels start rising years before motor symptom onset. In presymptomatic carriers, elevated plasma NfL predicts higher risk of converting to the symptomatic phase within a few years. Longitudinal studies show that elevated baseline NfL predicts faster clinical progression and greater brain atrophy during follow-up. It is considered one of the strongest prognostic biomarkers for HD | Highly sensitive to neurodegenerative changes. NfL increases with disease progression and correlates with clinical severity (e.g. UHDRS motor scores) and ‘disease burden’ (CAG – age product). Compared with other biomarkers, NfL has shown better capacity to monitor progression: plasma levels reflect functional decline and neuronal loss in real time. It is being used in HD clinical trials as an exploratory marker for neurodegeneration monitoring and therapeutic efficacy |
| Tau (total or phosphorylated) (protein) | CSF (ELISA assays) | Protein associated with neurodegenerative pathology. Some patients with HD show elevated total tau in CSF, but evidence of its predictive value is weak. One study found no significant differences in tau between presymptomatic carriers and early-stage patients, nor correlation with proximity to onset. Therefore, tau appears less useful than NfL for predicting progression in HD | Tau tends to slightly increase with HD advancement but with high individual variability. In direct comparison, NfL showed stronger correlations with progression than tau. Currently, tau is not considered a good longitudinal change indicator in HD (unlike its established use in Alzheimer’s), although it could have complementary value combined with other markers |
| GFAP (protein) | Plasma (ultrasensitive Simoa assay) | Marker of astroglial activation. Not used for risk prediction before symptoms, as notable elevation occurs near manifest neurodegeneration. However, presymptomatic carriers close to conversion may begin to show subtle increases | Useful as an indicator of glial progression: plasma GFAP levels are elevated in patients with HD compared with controls (greater differences in advanced stages). They significantly correlate with motor (UHDRS-TMS) and functional (UHDRS-TFC) severity, as well as with NfL (both increase in parallel as neurodegeneration advances). GFAP could complement NfL by indicating concurrent astroglial activation with neuronal damage |
| Inflammatory markers (protein), e.g. cytokines IL-6, IL-8; YKL-40 protein | Plasma or CSF (immunoassays) | Neuroinflammation is part of HD pathogenesis. Certain mediators such as IL-6 have been identified as possible early biomarkers: elevated plasma IL-6 concentrations were associated with imminent converters. Similarly, YKL-40 (a glial inflammation protein) was found elevated in HD and correlated with clinical traits (e.g. cognitive problems). It remains to be validated whether these markers independently predict progression | Several studies show that proinflammatory cytokines (IL-6, IL-8, TNF-α) and YKL-40 levels rise as disease worsens, reflecting chronic microglial and astroglial activation. For example, YKL-40 in CSF increases with severity and may relate to specific manifestations (cognitive). However, the high biological variability of cytokines limits their use for individual monitoring; they might be more useful as part of combined biomarker panels rather than stand-alone indicators |
| Brain metabolites (NAA, myo-inositol, etc.) (metabolic) | MRS | Brain metabolic alterations precede clinical neurodegeneration. In presymptomatic individuals, MRS has detected NAA reduction in the striatum (putamen) years before motor onset. Decreased NAA (a marker of healthy neurons) suggests early neuronal loss and predicts future symptom emergence. Other metabolites such as myo-inositol may rise, anticipating gliosis | MRS enables in vivo monitoring of brain biochemistry. Longitudinal studies show progressive NAA decreases and myo-inositol increases in basal ganglia as HD advances, correlating with clinical deterioration. These metabolic changes provide an objective measure of neuronal and glial degeneration. However, technical factors (different MRS protocols) can affect comparability between centres, emphasizing the need for standardization for routine use |
| Brain glucose metabolism (metabolic) | 18F-FDG PET imaging (neuroimaging) | Regional brain hypometabolism is an early indicator. In presymptomatic carriers, PET-FDG reveals decreased glucose metabolism in the striatum (caudate and putamen) many years before clinical conversion. The magnitude of striatal metabolic reduction inversely correlates with the CAG × age product (CAP score), suggesting that the closer the onset, the more pronounced the hypometabolism | Throughout progression, PET-FDG shows the spread of metabolic deficits from the basal ganglia to the cerebral cortex. This pattern can be quantitatively monitored: for example, a characteristic HD metabolic network becomes more pronounced over time in premanifest individuals. Although PET-FDG is sensitive for monitoring neurodegenerative progression, its use is limited by cost and accessibility, reserved mainly for research settings or complementary evaluation in atypical cases |
| Oxidative and mitochondrial stress (metabolic), e.g. 8-OHdG, mtDNA | Urine (8-OHdG); plasma (free mtDNA) | Systemic oxidative damage exists from early stages of HD. One study found that urinary 8-OHdG (a product of oxidative DNA damage) is elevated in HD mouse models and patients with HD compared with controls, suggesting it could signal pathological progression | Peripheral markers like circulating mtDNA (an indicator of mitochondrial dysfunction) have also been proposed: abnormal mtDNA levels in the plasma of patients with HD were associated with advanced stages. They may reflect activation of cumulative cellular damage pathways. Although promising, these biomarkers require more research to establish their kinetics in HD and reliability for individual clinical monitoring |
ASO = antisense oligonucleotide; CAG = cytosine–adenine–guanine; CAP = CAG–Age Product (disease-burden score); CSF = cerebrospinal fluid; ELISA = enzyme-linked immunosorbent assay; FDG = 18F-fluorodeoxyglucose; GFAP = glial fibrillary acidic protein; GWAS = genome-wide association study; HD = Huntington’s disease; HTT = huntingtin; IL = interleukin; mHTT = mutant huntingtin; MRS = magnetic resonance spectroscopy; mtDNA = mitochondrial DNA; NAA = N-acetyl aspartate; NfL = neurofilament light chain; 8-OHdG = 8-hydroxy-2′-deoxyguanosine; PET-FDG = positron emission tomography with 18F-FDG; Simoa = single molecule array; TNF-α = tumor necrosis factor alpha; UHDRS = Unified Huntington’s Disease Rating Scale; UHDRS-TFC = Unified Huntington’s Disease Rating Scale–Total Functional Capacity; UHDRS-TMS = Unified Huntington’s Disease Rating Scale–Total Motor Score; YKL-40 = chitinase-3-like protein 1 (CHI3L1).
Table 2: Summary of the 13 included studies2,4–6,14,17–24
| Study | Population | Disease stage | Biomarker | Assay/platform | Key results |
| Paulsen et al. 20142 | NR in manuscript (prospective observational cohort of HTT-positive carriers and controls) | Premanifest; early- manifest | MRI/clinical imaging indices (progression prediction) | Structural/functional imaging (platform NR) | Imaging measures with clinical data predicted conversion to manifest HD in gene carriers. Imaging abnormalities precede clinical onset |
| Genetic Modifiers of Huntington’s Disease (GeM-HD) Consortium 20154 | NR | Genetic (all stages; prognostic) | Genetic modifiers (DNA repair loci, e.g. MSH3, FAN1) | GWAS/genotyping | Modifier variants significantly shift age at motor onset, supporting somatic expansion/repair pathways as determinants of progression |
| Byrne et al. 20185 | NR | Premanifest; manifest | mHTT (CSF), NfL (CSF/plasma) | Ultrasensitive immunoassays (Simoa) | CSF mHTT reflects disease-specific burden; plasma/CSF NfL elevated versus controls and associates with severity/progression; complementary roles (mHTT pharmacodynamic, NfL neurodegeneration) |
| Byrne et al. 20176 | NR (retrospective cohort) | Premanifest; manifest | NfL (blood) | Ultrasensitive immunoassays | Blood NfL is higher in HD carriers (often 2–3× in those near onset) and correlates with disease burden; tracks neuronal damage better than many clinical scales |
| Niemelä et al. 201714 | NR | Manifest HD; controls | NfL versus total tau (CSF) | Immunoassays (ELISA/other, as used in study) | NfL outperforms total tau for distinguishing HD and reflecting severity; tau shows weaker predictive utility for conversion |
| Rodrigues et al. 202017 | NR (longitudinal, ~24 months) | Premanifest; early- manifest | mHTT (CSF), NfL (CSF/plasma) | Simoa/ultrasensitive assays | Distinct longitudinal dynamics: NfL rises with progression and correlates with functional decline (e.g. inverse with UHDRS- TFC), while CSF mHTT better serves as a pharmacodynamic marker of HTT lowering |
| Caron et al. 202218 | NR | Premanifest; manifest | CSF panel: mHTT, NfL, tau, YKL- 40, others | Multiplex/ELISA/ultrasensitive (per analyte) | Multianalyte CSF panels classify HD stage better than single markers; YKL- 40 (astro -microglial) associates with burden and cognition; tau less informative versus NfL |
| Barschke et al. 202219 | NR | Manifest | CSF PENK and PDYN peptides | CSF peptide quantification (platform NR) | PDYN/PENK are reduced in HD and correlate with Total Functional Capacity, reflecting striatal medium spiny neuron loss |
| Tang et al. 201320 | NR | Premanifest | 18F-FDG PET metabolic network | PET- FDG | Identified an HD-specific metabolic network in premanifest carriers; network expression increases with proximity to onset and progression, supporting PET as a progression biomarker |
| Rodrigues et al. 201621 | NR | Manifest; some premanifest | CSF inflammatory markers (IL- 6, IL- 8, YKL- 40/CHI3L1) | Immunoassays | Inflammatory biomarkers elevated and reflect clinical severity; variability limits stand-alone prognostic use but complements neurodegenerative markers |
| You et al. 202122 | NR | Premanifest; manifest | GFAP (blood) | Ultrasensitive Simoa | GFAP increased (~2–3× in symptomatic versus controls) and correlates with motor/functional severity; rises along with NfL as disease advances |
| Lee et al. 201223 | NR | Genetic/prognostic across spectrum | CAG repeat length (HTT) | Genetic testing | Strong inverse relationship with age at onset (e.g. pooled r≈-0.787 reported in manuscript); genetic load shapes prognosis but is static (monitoring utility limited) |
| Voysey et al. 202424 | NR (14 -year longitudinal) | Premanifest; transitional | NfL (plasma/CSF, per cohort methods) | Ultrasensitive immunoassays | Long-term trajectories show NfL rises years before onset and continues through transition; supports NfL as an early, sensitive progression marker over long intervals |
CHI3L1 = chitinase 3-like protein 1; CSF = cerebrospinal fluid; ELISA = enzyme-linked immunosorbent assay; FAN1 = FANCD2/FANCI-associated nuclease 1; FDG = 18F-fluorodeoxyglucose; GFAP = glial fibrillary acidic protein; GWAS = genome-wide association study; HD = Huntington’s disease; HTT = huntingtin; IL = interleukin; mHTT = mutant huntingtin; MRI = magnetic resonance imaging; MSH3 = MutS homolog 3; NfL = neurofilament light chain; NR = not reported; PDYN = prodynorphin; PENK = proenkephalin; PET = positron emission tomography; PET-FDG = positron emission tomography with 18F-FDG; Simoa = single molecule array; UHDRS-TFC = Unified Huntington’s Disease Rating Scale–Total Functional Capacity; YKL-40 = chitinase-3-like protein 1 (CHI3L1).
Longitudinal natural history datasets
The incorporation of three landmark studies markedly enlarges the empirical base. Tracking Huntington’s Disease (TRACK- HD; n=298) established that plasma NfL rises ∼threefold above levels in controls and correlates with both CAG length and brain volume loss, making it a sensitive marker of subclinical change.25 Huntington’s Disease Young Adult Study (HD- YAS) followed gene carriers 24 years before predicted onset and demonstrated measurable increases in NfL and MRS glutamine decades in advance (Table 3 and Figure 2).7,26 Enroll- HD, the largest global registry (>24,000 participants), confirms the monotonic rise of NfL and provides an open resource for external validation of emerging analytes.27
Table 3: Overview of high-impact longitudinal cohorts7
| Cohort | Sample size (gene carriers/controls) | Follow-up (years) | Principal biomarkers | Key contributions |
| TRACK -HD | 298/123 | 4 | Plasma NfL, volumetric MRI, quantitative motor tests | Defined early NfL inflection point; validated imaging endpoints |
| HD- YAS | 130/117 | On-going7 | NfL, MRS metabolites, cortical thickness | Detected biomarker change 20+ years preonset |
| Enroll- HD | >24,000/>9,000 | Up to 12 | NfL, mHTT, digital measures, genotyping | Provides reference trajectories and biosamples for validation |
HD-YAS = Huntington’s Disease Young Adult Study; mHTT = mutant huntingtin; MRI = magnetic resonance imaging; MRS = magnetic resonance spectroscopy; NfL = neurofilament light chain; TRACK-HD = Tracking Huntington’s Disease.
Figure 2: Temporal sequence of biomarker deviations across the Huntington’s disease continuum
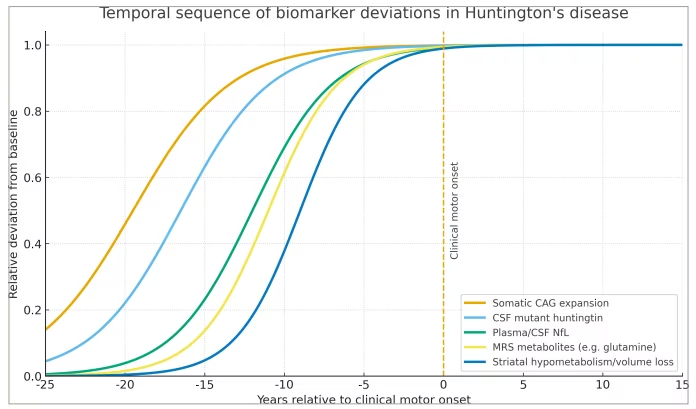
Logistic curves depict the relative deviation (0=baseline/healthy control; 1=maximal abnormality) for (i) somatic CAG-repeat expansion, (ii) CSF mHTT, (iii) plasma/CSF NfL, (iv) MRS metabolites (e.g. glutamine/glutamate) and (v) striatal hypometabolism or volume loss on PET-FDG/MRI. The dashed vertical line marks clinical motor onset (time 0). The figure highlights how genetic and molecular changes precede axonal injury, metabolic alterations, neuroimaging abnormalities and clinical conversion by up to two decades. CAG = cytosine–adenine–guanine; CSF = cerebrospinal fluid; FDG = 18F-fluorodeoxyglucose; mHTT = mutant huntingtin; MRI = magnetic resonance imaging; MRS = magnetic resonance spectroscopy; NfL = neurofilament light chain; PET-FDG = positron emission tomography with 18F-FDG.
Genetic biomarkers
All included patients had a confirmed mutated HTT genotype. As expected, the length of the CAG expansion was associated with disease progression in several studies: patients with longer repeats tended to experience earlier and more aggressive disease. In adult populations with 40–55 CAG repeats, each increase of ~10 repeat units shortened the age of onset by several years. However, within groups with similar CAG repeat sizes, phenotypic variation was notable, prompting investigation into additional genetic modifiers. A major genome-wide association study by the Genetic Modifiers of Huntington’s Disease (GeM-HD) consortium identified polymorphisms in DNA repair-related genes (e.g. MutS homolog 3 [MSH3] on chromosome 5, loci on chromosome 15) as modulators of HD course. These genetic modifiers may influence the rate of somatic CAG expansion in neurons, thereby altering the pace of neurodegeneration. Clinically, this suggests that a patient’s complete genetic profile (beyond the HTT gene) could eventually refine progression prediction. However, it should be noted that genetic biomarkers are static; their value lies in prognostic prediction (i.e. who will develop the disease and how soon), rather than in monitoring disease status after onset. All studies agreed that the presence of the HTT mutation is a necessary but not sufficient determinant for forecasting individual disease trajectory, and that additional dynamic biomarkers are needed.28
Cis- acting modifiers
Beyond CAG length, somatic expansion rate within the repeat tract and the presence of interruptions (e.g. cytosine–adenine–adenine[CAA], cytosine–guanine–guanine [CGG]) account for up to 30% of variability in age at motor onset. Large- scale genome‐wide studies have linked mismatch repair polymorphisms (MutL homolog 1 [MLH1], MSH3, FANCD2/FANCI-associated nuclease 1 [FAN1]) and cis interruptions to delayed onset by 5–10 years.29 These data justify integrating modifier genotyping into prognostic algorithms and trial‐eligibility calculations.
Protein biomarkers
The most consistent findings came from proteins quantified in CSF and blood that reflect on-going neurodegenerative damage. NfL emerged as one of the most informative biomarkers. Multiple studies (both cross-sectional and longitudinal) showed that NfL is significantly elevated in HD carriers compared with controls, even before symptomatic conversion. One study reported that presymptomatic individuals nearing symptom onset (e.g. with high CAG × age burden) had plasma NfL levels 2–3 times higher than control averages. In symptomatic patients, NfL levels progressively increased with severity; for example, they strongly correlated with the disease burden score (defined as [CAG –- 35.5] × age) with r≈0.69 and showed an inverse correlation with functional capacity (r≈-0.70 in relation to UHDRS–Total Functional Capacity [UHDRS-TFC]).14 NfL demonstrated predictive capacity: in a 3-year follow-up, high baseline NfL was associated with a greater likelihood of clinical progression and brain atrophy during that period. In fact, it has been suggested that a single NfL measurement may forecast short- to medium-term trajectory better than some traditional clinical scales.17
By comparison, other measured proteins showed lower performance. Total tau protein in CSF, although related to neurodegeneration, did not effectively distinguish between presymptomatic and early-symptomatic individuals, nor did it significantly predict conversion – indicating that in HD, tau release into the CSF may be less prominent or may occur later than the NfL increase.
Another key finding was the presence of measurable mHTT in the CSF of patients. Using ultrasensitive assays (Simoa technology), recent studies detected soluble mHTT in CSF even in preclinical stages (albeit at low levels). In early-symptomatic stages, CSF mHTT concentration correlated with striatal atrophy and total brain volume, suggesting that it reflects the burden of aggregates or toxic fragments being released. Compared with NfL, mHTT showed a more modest longitudinal rate of change, and in one 24-month study, its prognostic value was lower than that of NfL. Nevertheless, mHTT is crucial as a marker of disease-specific mechanism; its reduction in CSF following experimental therapies (e.g. antisense drugs such as tominersen) confirmed target engagement and inhibition of mutant protein production. Thus, mHTT is proposed more as a marker of therapeutic response (pharmacodynamic indicator) than as a sensitive marker of natural disease progression, whereas NfL is an excellent biomarker of disease state and cumulative neuronal damage. Together, they offer complementary information.17
Regarding other protein biomarkers in peripheral fluids, there were notable findings: plasma GFAP was elevated ~2–3 times in patients with symptomatic HD versus controls, correlating with the UHDRS motor score (a neurodegeneration indicator).17 Even in presymptomatic carriers, GFAP tended to rise as they approached clinical conversion, although less markedly than NfL. This suggests that astroglial activation (reflected by GFAP) occurs alongside axonal degeneration and could serve as a complementary biomarker for monitoring progression – especially in stages where reactive glia play a significant role (possibly more advanced stages).17
For inflammatory markers, levels of certain cytokines (IL-6, IL-8) in plasma and CSF were higher in patients with HD compared with controls, with some correlations to severity reported.15 For instance, plasma IL-6 was associated with poorer cognitive performance and greater atrophy in one cross-sectional study. YKL-40 (CHI3L1), primarily derived from astrocytes and microglia, was found elevated in HD CSF and was associated with disease burden and cognitive dysfunction.17 However, the utility of these inflammatory markers is limited by individual variability and the influence of comorbidities (e.g. infections), and they are not yet validated for routine clinical use. A recent study highlighted that combinations of multiple protein biomarkers could improve patient stratification: for example, a panel including mHTT, NfL, tau and YKL-40 classified individuals by HD stage better than any single marker. This supports a future multi-analyte panel approach to capture diverse pathological aspects (neuronal degeneration, glial dysfunction, inflammation, etc.).18
Broader landscape
CSF peptides derived from prodynorphin and proenkephalin are significantly reduced in manifest HD, reflect striatal medium spiny neuron loss and correlate with Total Functional Capacity scores.19 CHI3L1/YKL-40, a marker of astro-microglial activation, shows progressive elevation from premanifest through late stages, paralleling cytokine signatures.30 These findings broaden the proteomic toolbox beyond NfL and mHTT and offer complementary pathophysiological readouts.
Metabolic biomarkers
Neuroimaging techniques and biochemical measurements provided evidence of premanifest brain changes. MRS consistently showed reduced N-acetyl aspartate (NAA) peaks in the basal ganglia (especially in the putamen) of pre-HD carriers compared with controls.31 A recent systematic review reported that ~78% of conducted comparisons found significantly reduced NAA in the putamen of premanifest subjects.31 As NAA is a marker of neuronal integrity, its decline suggests neuronal loss or dysfunction even before clinical symptoms emerge. Concurrently, myo-inositol (a glial/osmotic marker) was increased in some brain regions of premanifest individuals, potentially indicating early glial activation. These changes become more pronounced in symptomatic patients: for instance, individuals in early stages showed lower NAA and higher myo-inositol than subjects with pre-HD, and these differences intensified in advanced stages. Although the measured metabolites varied slightly across studies, the general conclusion is that MRS detects progressive brain metabolic alterations in HD, supporting its role as a progression biomarker. Technical limitations, such as heterogeneity in MRS acquisition parameters across centres, were noted, but overall, 3 Tesla MRS using standardized Point RESolved Spectroscopy (PRESS) sequences provides reproducible data.31
On the other hand, PET-FDG imaging revealed a specific pattern of cerebral hypometabolism in HD. In presymptomatic individuals, reduced glucose metabolism in the striatum was observed even >10–15 years before the predicted onset, compared with controls. The severity of this metabolic reduction correlated with proximity to onset: a combined CAG and age index (CAP score) showed an inverse correlation with striatal FDG uptake.32 As the disease progresses, PET studies revealed that hypometabolism extends to the frontal and parietal cortices in symptomatic stages, reflecting the spread of neurodegeneration. A metabolic network analysis indicated a characteristic progressive metabolic pattern in HD; this pattern increases in expression as the disease advances and is reproducible across centres, potentially serving as a composite progression biomarker in clinical trials. However, in practice, PET-FDG is costly and invasive (radiation exposure), so its primary use remains investigational.20
Finally, studies on peripheral biomolecules suggest that HD involves detectable systemic alterations. For example, urinary 8-OHdG measurements were elevated in patients with HD compared with controls, reflecting increased oxidative DNA damage in the body. Similarly, significantly elevated levels of circulating free mtDNA were found in patients’ plasma, consistent with known mitochondrial dysfunction in HD.16 These oxidative-metabolic biomarkers may be useful for monitoring the effect of therapies aimed at reducing oxidative stress or improving mitochondrial function. In fact, in an HD mouse model, an experimental mitochondrial therapy (P110, a mitochondrial fission inhibitor) reduced 8-OHdG, mtDNA and inflammatory markers to near-control levels, suggesting these biomarkers may also serve to assess treatment response in humans. Nevertheless, in human patients, data remain preliminary, and larger sample sizes are needed to confirm their validity.16
Clinical subgroup analysis
Several studies provided specific data in relevant subgroups:
-
Presymptomatic (pre-HD): In individuals carrying the mutation without symptoms, some biomarkers already showed significant changes compared with non-carrier controls. As described, plasma/CSF NfL and reduced brain NAA were early findings in this group. However, these changes were typically more noticeable in presymptomatic individuals closer to the expected age of onset (based on their CAG repeat length and family history). In younger presymptomatic individuals, far from disease manifestation, many biomarkers (NfL, brain volumes, clinical measures) were still within the normal range.17 This highlights the importance of considering ‘time to onset’ within presymptomatic carriers: for example, a carrier approximately 5 years from probable onset may have elevated NfL and mild striatal atrophy, whereas another more than 20 years from onset may be practically indistinguishable from controls in biomarker profiles. Across studies, presymptomatic individuals benefited from longitudinal measurements: those who converted to symptomatic during follow-up exhibited steep upward trajectories of NfL and accelerated declines in neuroimaging biomarkers in the last few years before diagnosis, compared with those who remained asymptomatic. This suggests that a combination of markers (e.g. annual increase in NfL +striatal volume loss) could one day be used to determine when to initiate preventive therapies in carriers.
-
Early-symptomatic patients: In the initial stages after motor manifestation, the fastest changes were observed in many biomarkers. For example, the first 5 years after motor onset were associated with exponential rises in NfL (often reaching >4–5 times normal levels) and accelerated reductions in caudate volume on magnetic resonance imaging (MRI).17 Clinically, this was the phase when motor scales deteriorate most rapidly. Biomarkers proved useful to quantify this progression: a longitudinal study indicated that the annual rate of change in plasma NfL correlated with annual functional score loss (UHDRS) in patients with early-stage HD (r≈0.5). This suggests that in clinical trials, these markers could reduce the necessary sample size by detecting changes more sensitively than clinical assessments during this period. Furthermore, in this stage, some experimental markers such as plasma GFAP also began to clearly differentiate from controls, supporting the idea that reactive glial pathology intensifies once clinical neurodegeneration begins.
-
Patients in advanced stages: Fewer studies specifically focused on this group, but available data indicate that many biomarkers reach a ‘ceiling’ or plateau in very late stages. For instance, extremely elevated CSF NfL (above a certain level) might not distinguish between an intermediate-stage and an advanced-stage patient, possibly because the rate of neurodegeneration slows down once a large number of susceptible neurons have already been lost. Similarly, striatal volume on MRI drastically reduces in the early years and then stabilizes near a residual minimum. However, other markers such as GFAP or YKL-40 could continue increasing in advanced stages due to on-going inflammation/glial reactivity until terminal stages. Clinically, in advanced stages, motor scales saturate (complete loss of voluntary mobility, etc.), so biochemical biomarkers could help monitor disease progression when traditional neurological assessment loses sensitivity. An interesting finding was that some peripheral parameters, such as weight loss and systemic metabolic alterations (e.g. cortisol levels, trophic factors), became more pronounced in advanced stages, although these were not thoroughly studied as biomarkers in the included references.
-
Sex differences: None of the reviewed studies found significant differences between men and women in biomarker levels or trajectories after adjusting for age. For example, Rodrigues et al. indicated that CSF NfL and tau concentrations did not differ by sex.21 This suggests that the pathogenic mechanisms reflected by these biomarkers act similarly in both genders. However, other cohorts have described that women with HD might have slightly more peripheral inflammation than men, or that men might have slightly higher baseline NfL due to greater axonal mass; in the current evidence, these differences were not marked. Consequently, the analysed biomarkers can be clinically applied equally in male and female patients, with the caution of comparing to age-adjusted reference ranges but not necessarily sex-adjusted ones.
-
Age influence: Age is a critical factor to consider, as some biomarkers such as NfL gradually increase with age even in healthy individuals. Several studies used age-matched controls or statistically adjusted for age in their correlations. In general, the described patterns of biomarker elevation in HD exceed what would be expected from normal ageing. For example, the NfL increase in a 50-year-old patient with HD is much greater than the increase seen in a healthy 50-year-old compared with a 40-year-old.33 However, when comparing a 30-year-old patient with HD to a 60-year-old, age-related differences aside from the disease itself must be considered. Some findings suggest that progression rates might be faster in cases of young-onset HD (such as juvenile HD, <20 years, with high CAG repeats), where biomarkers reach extreme levels rapidly. However, this article did not include specific studies of juvenile HD, so that question remains open.22,34
In the assessment of risk of bias for the two cohort studies (Rodrigues et al. and Tang et al.), both recruited their exposed cohorts from selected groups of premanifest HD mutation carriers, limiting external representativeness.17,20 Nevertheless, non-exposed controls were carefully age- and sex-matched and drawn from the same community, ensuring baseline comparability. Exposure ascertainment was based on secure genetic records, and in both studies, it was confirmed that no participant exhibited the outcome of interest at baseline. Age – a key prognostic factor in HD progression – was controlled for in the analysis, and outcomes were assessed independently and blinded using clinical scales, objective biomarkers, PET and MRI. Follow-up was sufficiently long (24 months in Rodrigues et al. and up to 7 years in Tang et al.), and retention exceeded 90%, meaning nearly all subjects were accounted for through study completion (Table 4).17,20
Table 4: Risk of bias cohort studies (Newcastle–Ottawa)17,20
| Pregunta | Rodrigues et al.17 | Tang et al. 201320 |
| Representativeness of the exposed cohort | Selected group of users, e.g. nurses, volunteers (Huntington gene mutation patients) | Selected group of users, e.g. nurses, volunteers (premanifest HD mutation carriers) |
| Selection of the non-exposed cohort | Drawn from the same community as the exposed cohort (Control group paired by age and gender) (★) | Drawn from the same community as the exposed cohort (control group paired by gender and age) (★) |
| Ascertainment of exposure | Secure record (mutation genotipification ) (★) | Secure record (genetic confirmation) (★) |
| Demonstration that outcome of interest was not present at the start of study | Yes (at start of study) (★) | Yes (premanifest phase) (★) |
| Comparability of cohorts on the basis of the design or analysis | Study controls for age (key variable) (★) | Study controls for age (key variable) (★) |
| Assessment of outcome | Independent blind assessment (★) | Independent blind assessment (blind MRI analysis) (★) |
| Was follow-up long enough for outcomes to occur | Yes (24 months) (★) | Yes (7 years follow-up) (★) |
| Adequacy of follow-up of cohorts | Complete follow-up – all subjects accounted for (92.5% complete follow-up) (★) | Complete follow-up – all subjects accounted for (★) |
| Overall risk of bias | Moderate risk of bias | Moderate risk of bias |
A star (★) indicates the study met the specified quality criterion for that NOS item. Studies can receive up to 9 stars in total: Selection (max 4), Comparability (max 2), and Outcome (for cohort studies) or Exposure (for case–control studies) (max 3). More stars indicate higher methodological quality / lower risk of bias.
HD = Huntington’s disease; MRI = Magnetic resonance imaging; PET = positron emission tomography.
Among the systematic reviews evaluated, Brown et al. (2025) and Holmans et al. demonstrated high risk of bias across all domains (study eligibility criteria, identification and selection of studies, data collection and appraisal and synthesis of results), yielding an overall ‘high’ rating.28,32 In contrast, Martinez et al. achieved ‘low’ risk in the first three domains and ‘moderate’ in result synthesis, resulting in an overall low risk of bias.31 Morena et al. mirrored the patterns of Brown and Holmans, with high risk in every domain and overall, whereas Paulsen et al. showed mixed ratings (moderate for eligibility, data collection and synthesis; low for study identification and selection) culminating in an overall moderate risk of bias.15,33
In the cross-sectional studies, sample representativeness was deemed only somewhat adequate, sample sizes were uniformly inadequate and comparability between included and excluded subjects was not addressed.14,21,22 Although each study controlled for at least one relevant confounder and employed valid outcome assessment methods with appropriate statistical tests, shortcomings in sample size calculation and baseline comparability elevated the overall risk of bias to a high level for all three studies.
Discussion
This systematic review found that multiple categories of biomarkers – including genetic, proteomic and metabolic – provide critical insights into the prediction and monitoring of HD progression. The length of the CAG repeat in the HTT gene remains the strongest genetic determinant of disease onset. NfL in CSF and plasma emerged as the most robust protein biomarker for predicting disease trajectory and reflecting neurodegeneration. Metabolic markers such as N-acetylaspartate reduction detected via MRS and striatal hypometabolism assessed by PET-FDG were also consistently altered before clinical onset, indicating early neuronal dysfunction.
Our findings align with a substantial body of literature underscoring the prognostic significance of CAG repeat length in the HTT gene concerning HD onset. A comprehensive meta-analysis reported a pooled correlation coefficient of -0.787 (95% confidence interval: -0.756 to -0.815) between CAG repeat length and age at onset, indicating that longer repeats are robustly associated with earlier disease manifestation. Furthermore, studies have demonstrated that extended CAG repeats not only predict earlier onset but also correlate with accelerated disease progression and reduced survival post-onset.23
Regarding NfL, our review corroborates its role as a sensitive and early biomarker for HD. Elevated plasma NfL levels have been observed in premanifest individuals approaching clinical conversion, with concentrations 2–3 times higher than those in controls. These levels inversely correlate with functional capacity, as measured by the UHDRS-TFC, and positively correlate with disease burden. Notably, longitudinal studies have shown that NfL levels rise more rapidly in individuals closer to disease onset, suggesting its utility in predicting clinical trajectory over extended periods.4
Contrary to some earlier hypotheses, the predictive performance of total tau protein levels in CSF for HD progression remains inconclusive. While certain studies have reported elevated CSF tau levels in patients with HD compared with controls, others have found no significant differences between early-symptomatic and premanifest individuals, indicating limited utility in predicting disease onset or progression stages.6
Similarly, the role of inflammatory cytokines such as IL-6 and YKL-40 as biomarkers in HD is marked by inconsistencies. Some studies have identified elevated CSF levels of IL-6 and YKL-40 in patients with HD, suggesting a link to disease severity and neuroinflammation. However, other research has highlighted high biological variability and limited predictive power of these markers, with some findings indicating no significant alterations in IL-6 levels between patients with HD and controls. These discrepancies underscore the necessity for larger, standardized studies to validate the role of inflammatory biomarkers in HD.24
Integrative framework for clinical translation
Converging evidence now enables a three-tier composite index:
-
genetic load (CAG count ± modifier profile)
-
axon degeneration signal (plasma NfL)
-
mutant burden (CSF mHTT).
Pilot studies indicate that a weighted combination of mHTT and NfL reduces samplesize requirements by 35% in proof-of-concept trials.35 Such composites can stratify participants, optimize dosing windows and act as pharmacodynamic readouts, as recently illustrated in mHTT-lowering and α-[11C]methyl-L-tryptophan (AMT-130) gene-therapy studies.
A major strength of this systematic review is its comprehensive scope, synthesizing evidence across genetic, proteomic and metabolic domains and applying strict PRISMA methodology (Figure 1).9 The inclusion of longitudinal data strengthens understanding of biomarker dynamics over time. Furthermore, quality-assessment tools (e.g. NOS) were systematically applied to evaluate the risk of bias in included studies.
While the earliest detectable changes in HD biology occur in the premanifest and early-manifest phases, integrating data from patients at advanced clinical stages is essential to delineate the full biomarker trajectory. In line with previous work, we observed that several axonal markers (e.g. CSF/plasma NfL) and structural indices (striatal volume) reach a biological ‘ceiling’ once neuronal reserve is largely exhausted, whereas glial- and inflammation-related proteins such as GFAP and YKL-40 continue to rise, reflecting on-going astro-microglial reactivity even in late disease. These observations illustrate:
-
which biomarkers lose discriminative power once degeneration plateaus
-
which remain dynamic and useful for monitoring therapeutic effects in severely affected patients
-
how end-stage values anchor the upper limits for cut-off determination when staging HD across its continuum.
Nonetheless, limitations must be acknowledged. The heterogeneity in biomarker measurement methods (e.g. different NfL assays, variations in PET protocols) complicates direct comparison across studies. Another limitation lies in the predominance of studies from North America and Europe, which may limit generalizability to diverse global populations. Finally, the relatively small sample sizes and short follow-up periods of some studies reduce the certainty about long-term biomarker trajectories.
Heterogeneity across biofluid platforms has prompted the HDClarity network (multi-site cerebrospinal fluid collection initiative in HD) to publish standard operating procedures covering CSF collection, centrifugation and storage, thereby reducing inter- site coefficients of variation from 23% to <10% for key analytes such as NfL and mHTT. This initiative is now referenced to contextualize assay-harmonization efforts.
The consistent evidence supporting plasma and CSF NfL levels as sensitive predictors of disease onset and progression suggests that NfL could be incorporated into clinical monitoring protocols for HD carriers, particularly those close to symptomatic conversion. Metabolic imaging findings also imply that MRS and PET-FDG could serve as supplementary tools in clinical trials for early intervention. Future research should prioritize multi-biomarker panels that integrate neurodegenerative, glial and inflammatory markers to improve predictive accuracy. Standardization of biomarker assays and longitudinal validation across ethnically diverse populations will be essential steps towards translating these findings into routine clinical use.
Conclusion
The results confirm that biomarkers provide valuable information for both predicting disease progression and monitoring it over time.
The fundamental genetic marker is the CAG expansion in HTT, which establishes the diagnosis and influences the age of onset, although other genetic modifiers contribute to refining the prognosis.
Among protein biomarkers, NfL stands out as a sensitive indicator of neurodegeneration: its levels in blood or CSF rise before the onset of symptoms, correlate with clinical severity and predict the future rate of decline. mHTT in CSF, meanwhile, directly reflects the pathogenic burden and is useful for evaluating responses to targeted therapies. Other markers such as tau are less useful, while GFAP and inflammatory proteins (IL-6, YKL-40) emerge as complementary indicators providing information on glial damage and concurrent inflammation.
Metabolic biomarkers show that neuronal dysfunction precedes clinical symptoms: the reduction of NAA in spectroscopy and striatal hypometabolism in PET appear in presymptomatic phases and progress in parallel with symptomatic worsening. Peripheral markers of abnormal metabolism and oxidative stress (such as 8-OHdG, mtDNA) also show differences in HD, although further validation is needed.